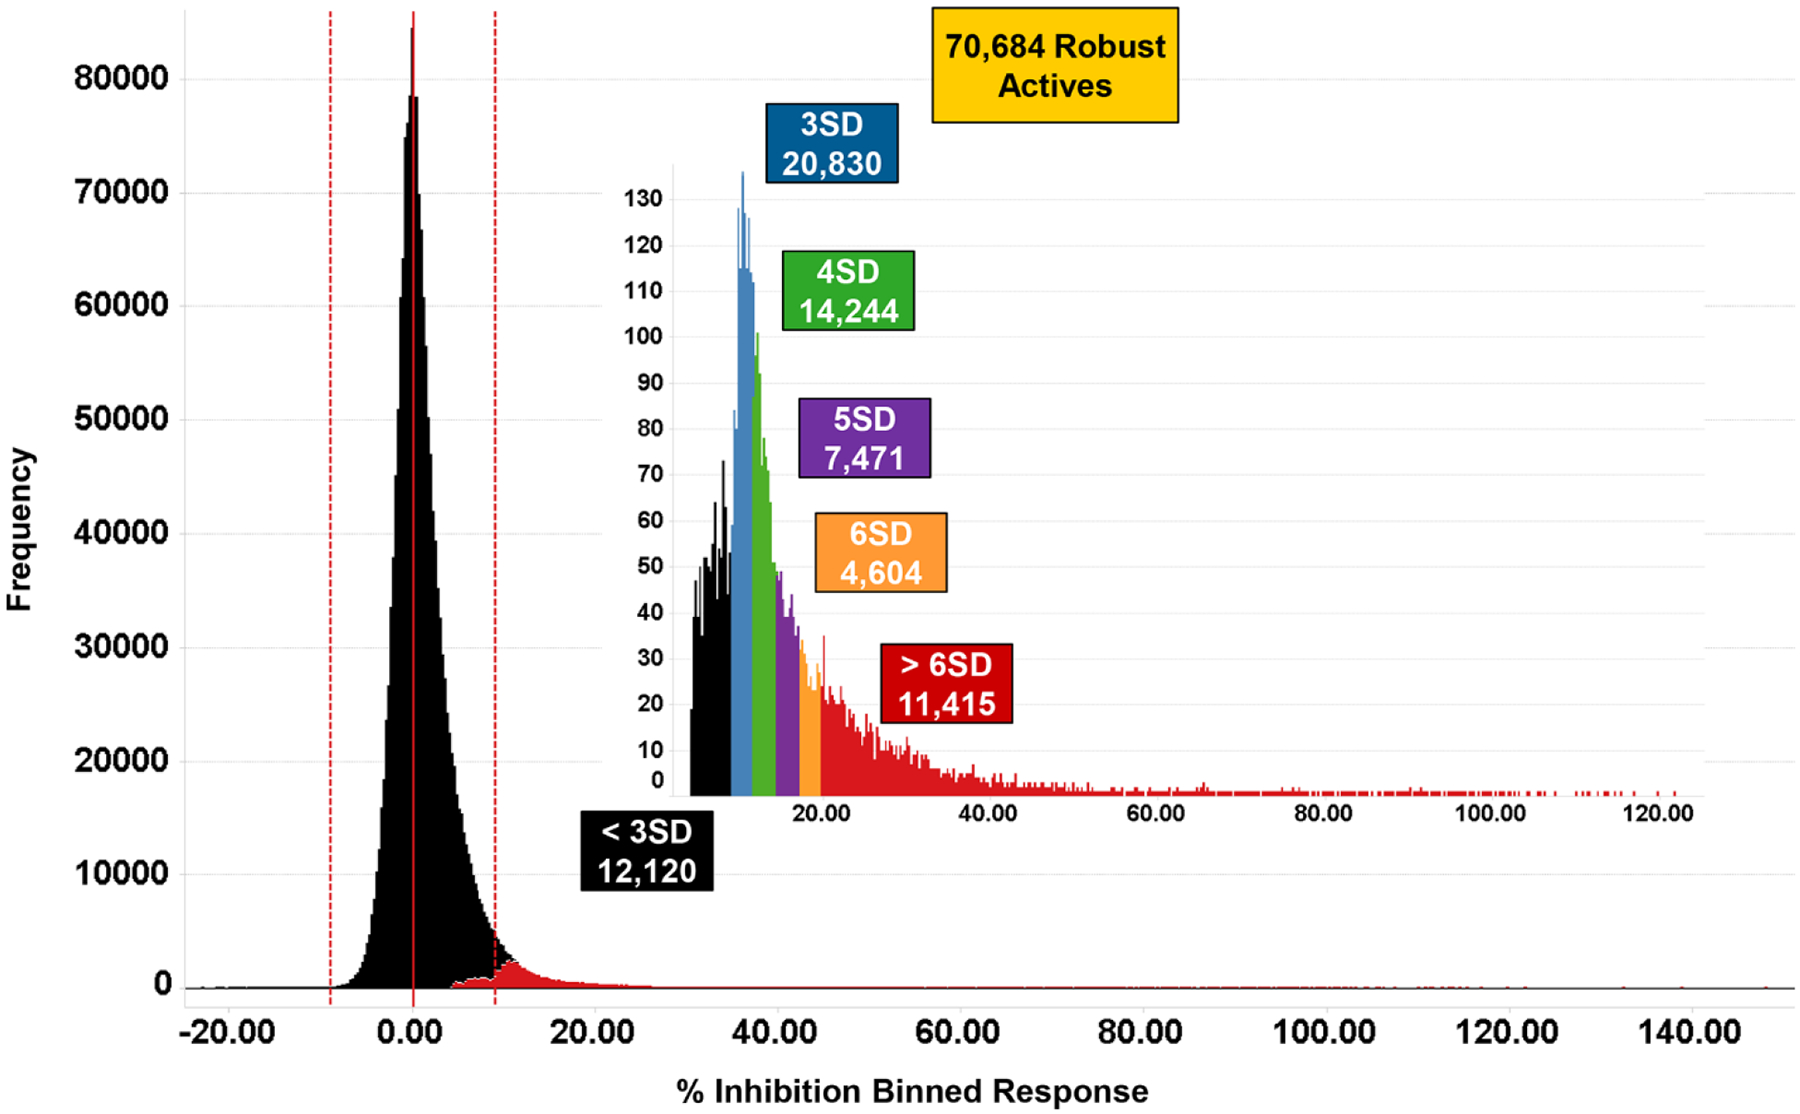
Figure 4.

Performance of PfENT1 primary HTS. Histograms of the distribution of responses for the PfENT1 HTS (1.8 million compounds, 10 μM test concentration) showing the number of compounds observed at a range of statistical cut-offs. The colored boxes indicate the number of test compounds that exceed cut-offs defined as the indicated multiples of the robust standard deviation of the data population.
