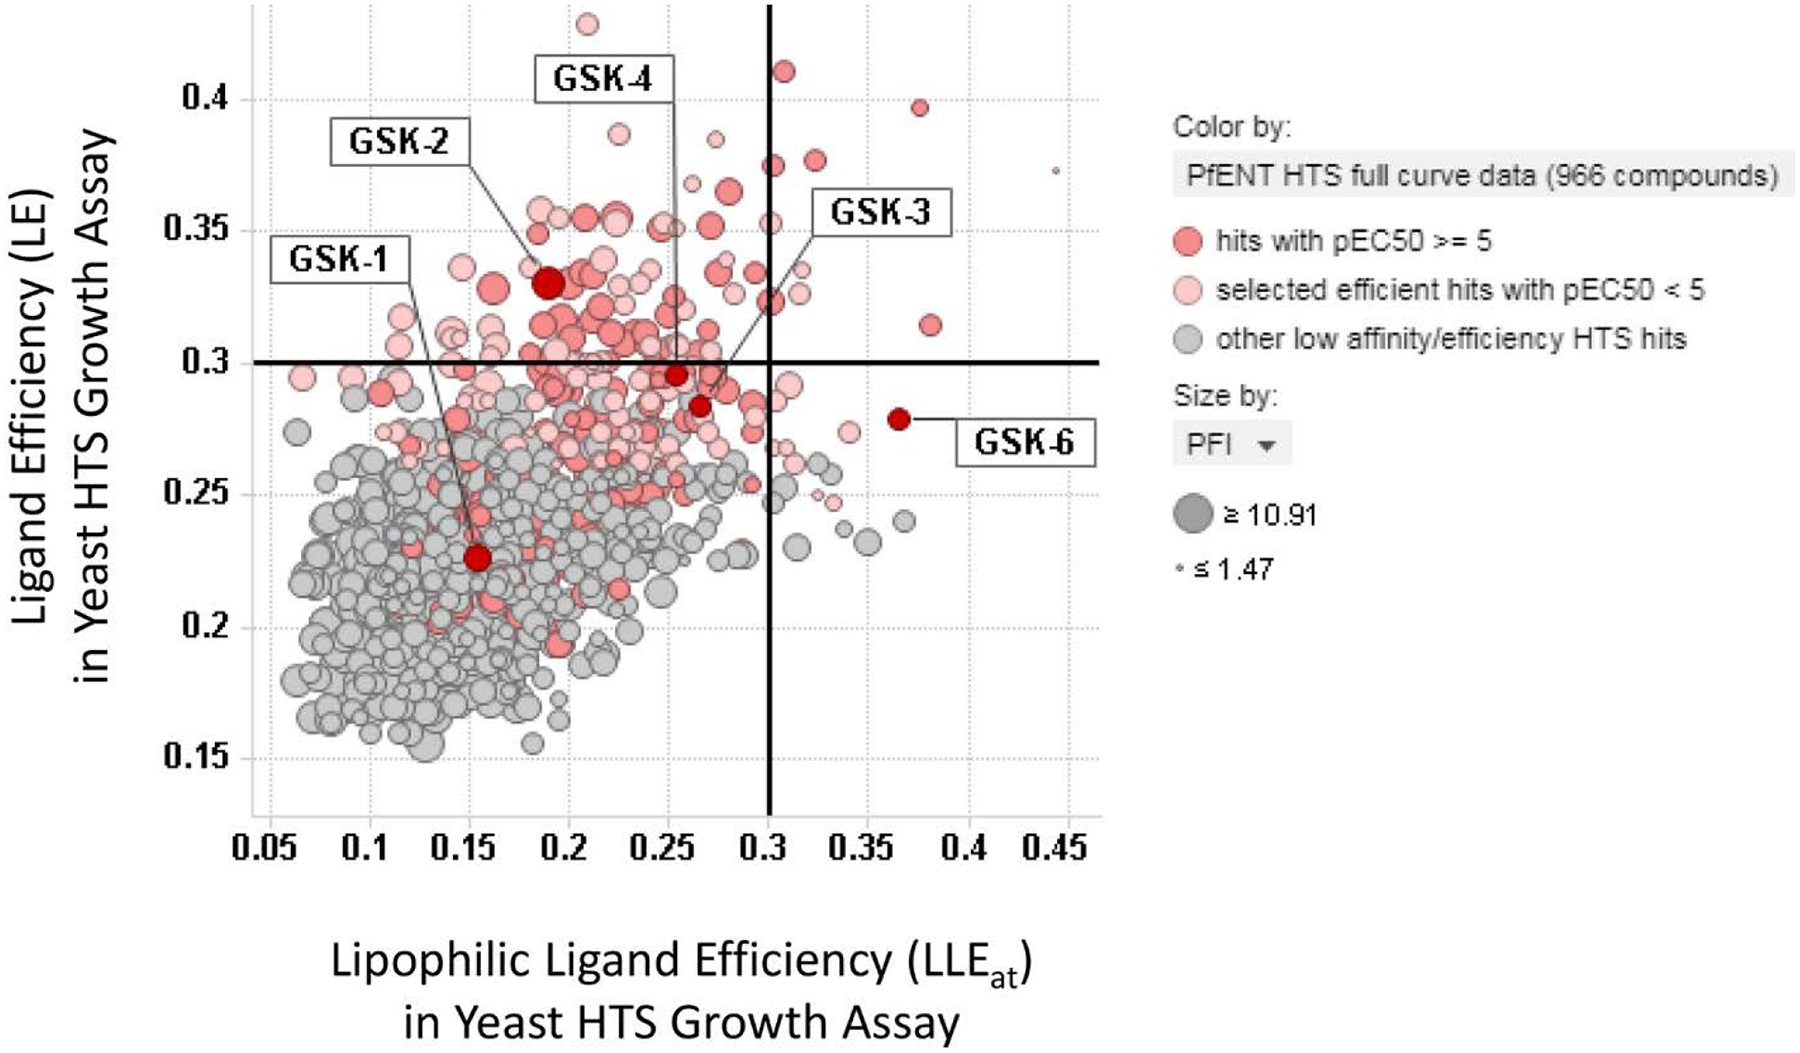
Figure 7.

Scatterplot of ligand efficiency (LE) versus lipophilic ligand efficiency (LLEat) for the 966 putative hits identified in the Yeast HTS Growth Assay. In general, the more ligand efficient hits (LE values >0.25, light red highlight) and higher activity hits (pEC50 5–7, dark red highlight) were used to seed scaffold-based substructure searches. The data points are sized by Property Forecast Index (PFI). Labels highlight extensively characterized compounds GSK-1, GSK-2, GSK-3, GSK-4, GSK-6.
