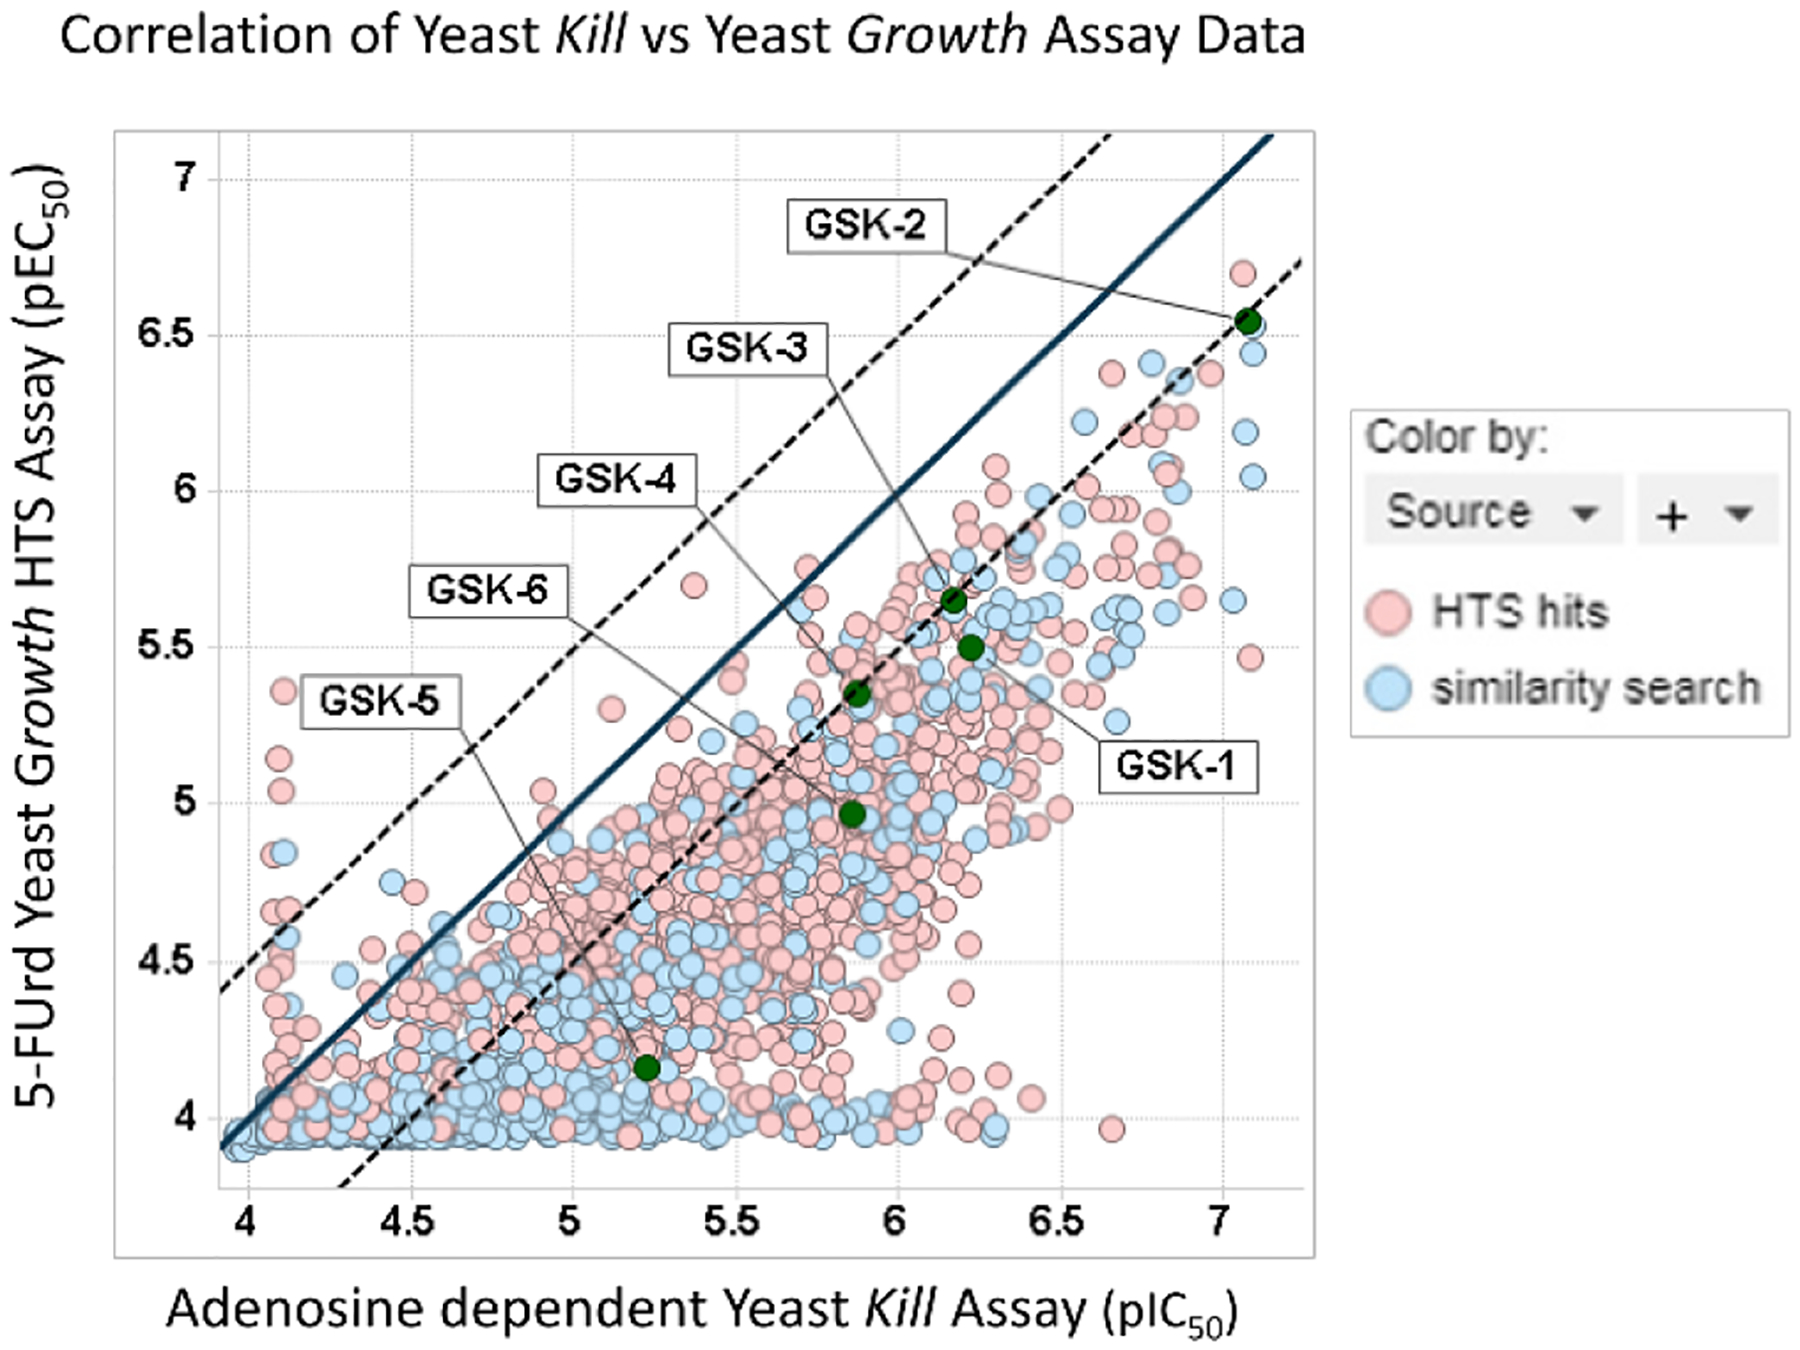
Figure 8.

Scatterplot shows good activity correlation between the Yeast HTS Growth Assay (pEC50) and the orthogonal Yeast Kill Assay (pIC50). The unity line (x=y) is shown as a black line and parallel dotted lines represent ± 0.5 log units. The source of the hit is identified by color highlight (HTS hit, red; scaffold-based substructure search, blue). Labels highlight extensively characterized compounds GSK-1 through GSK-6.
