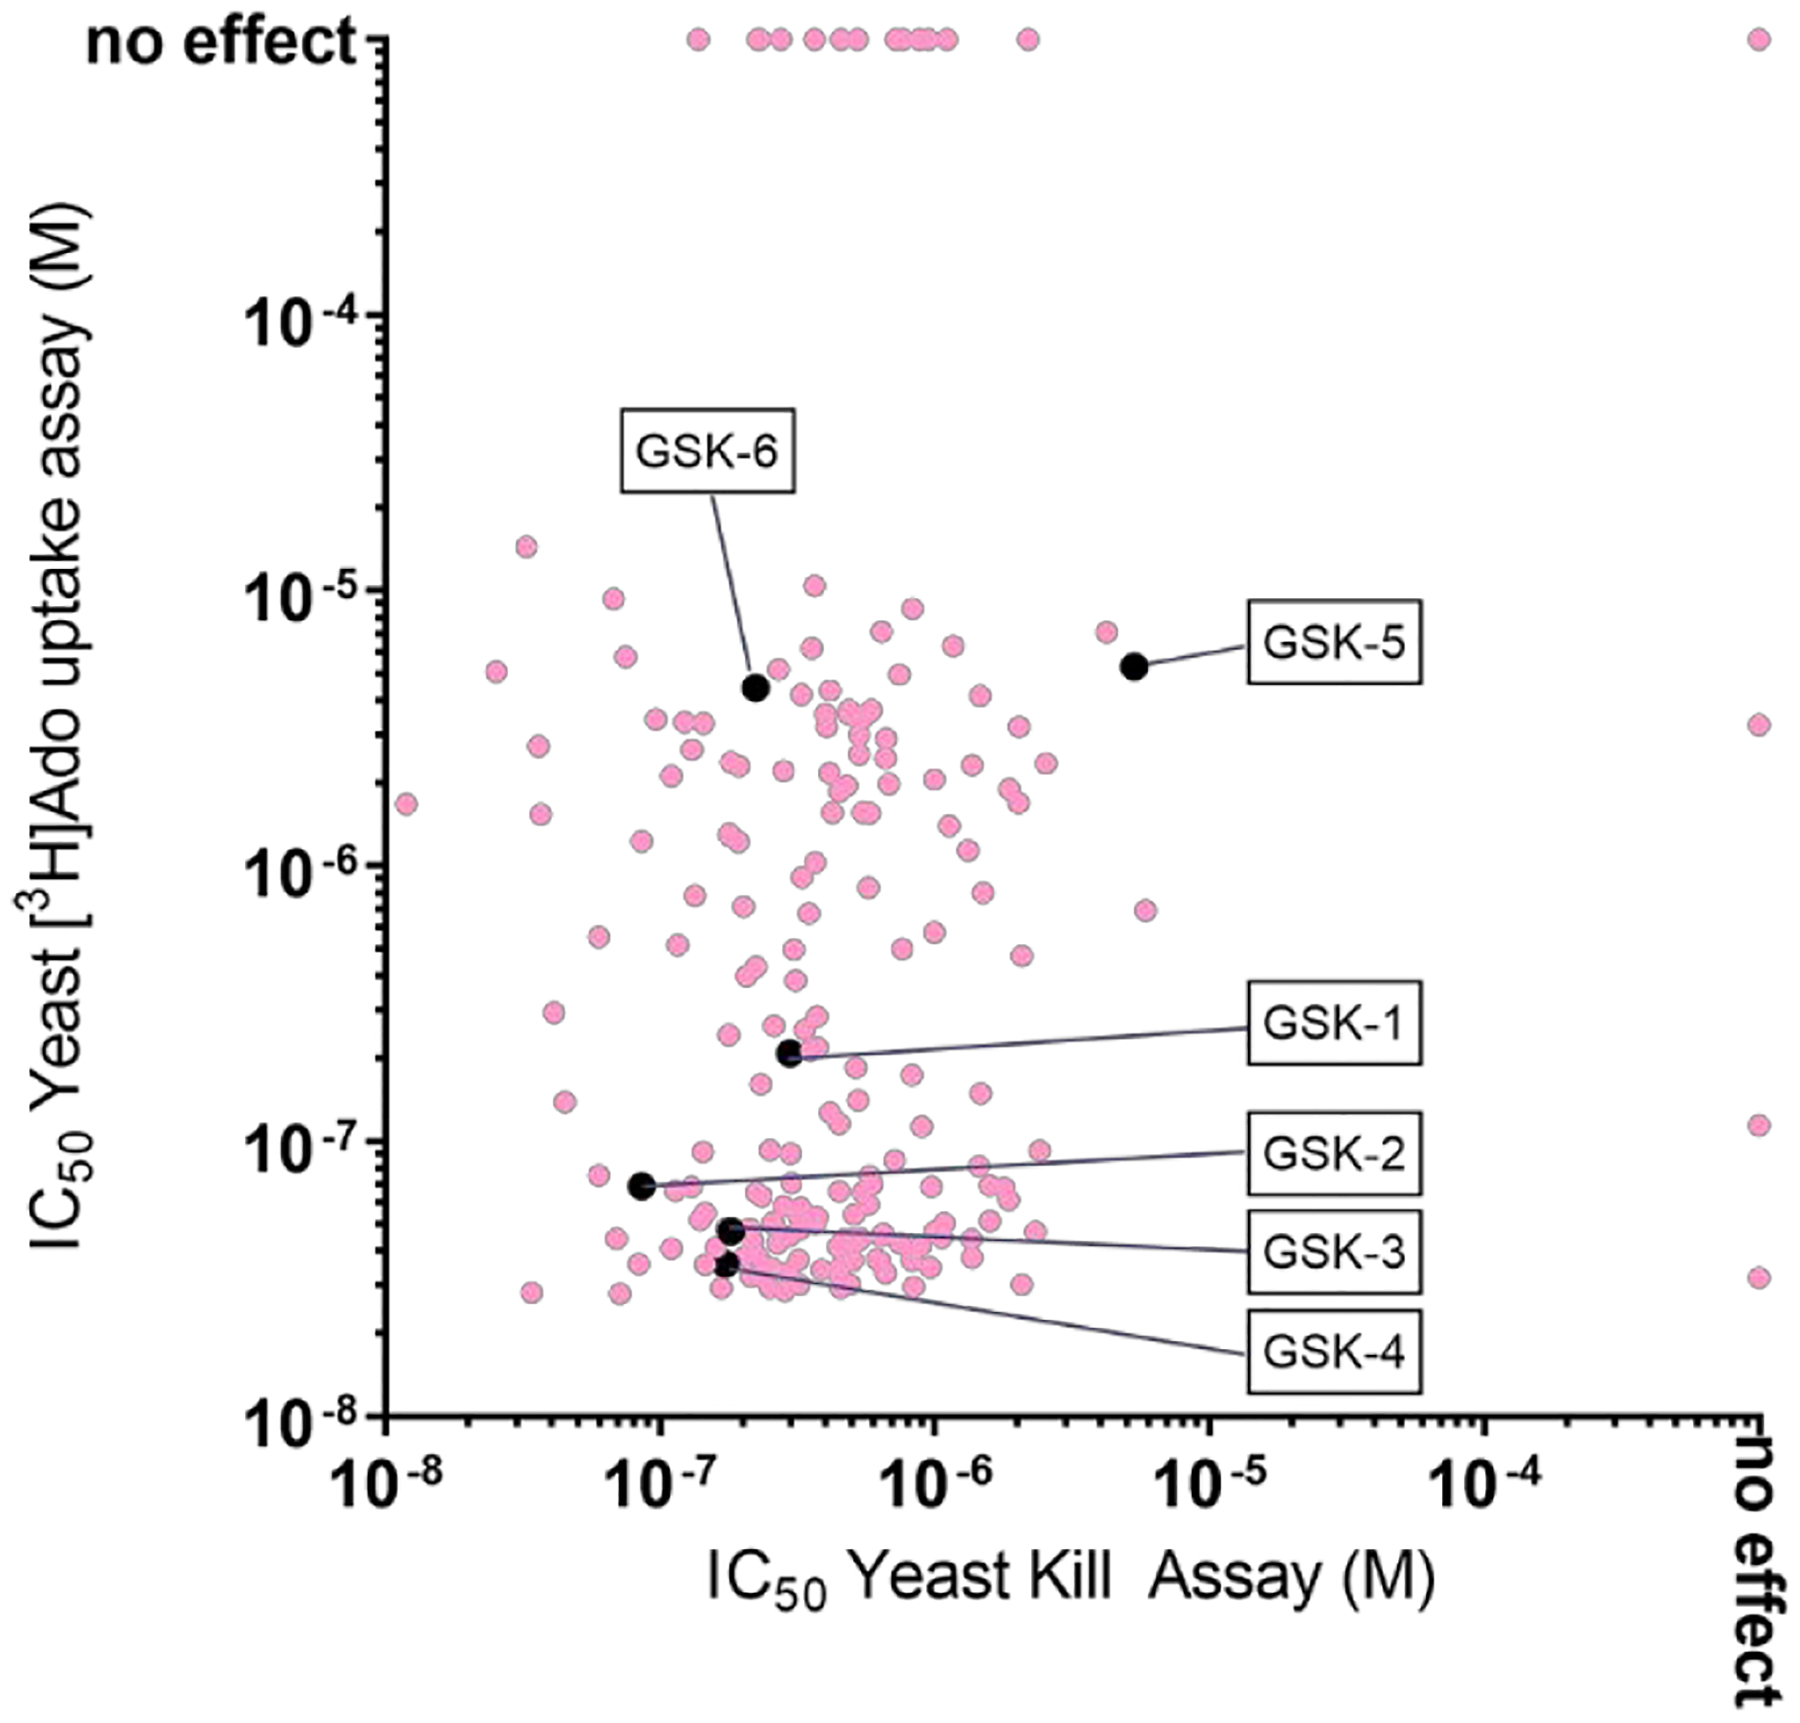
Figure 9.

Scatterplot of the potency of Wave 1 compounds in the [3H]adenosine uptake inhibition and Yeast Kill Assays. For each of the 201 HTS hits, the IC50 value in the 15 minute inhibition of [3H]adenosine uptake assay (y-axis) is plotted as a function of the IC50 value in the 19 hr Yeast Kill Assay (x-axis). Compounds for which there was no effect at the highest concentration tested, 100 μM, are plotted at ”no effect”. The pale red circles indicate the blinded hits. The black symbols indicate the six extensively characterized compounds. GSK-5 was identified during hit expansion.
