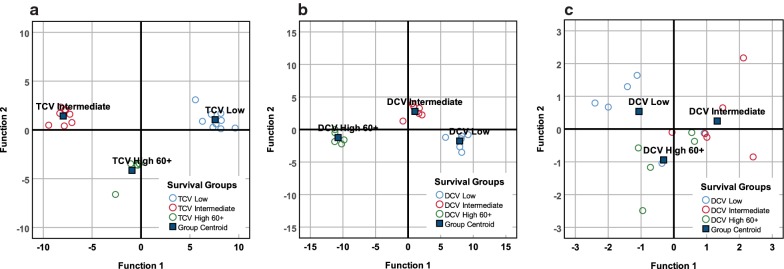
Fig. 3.
Discriminant analysis of changes in cytokine levels after three injections and survival groups. Distribution of TCV survival groups (a) using discriminant analysis of inflammatory cytokines (Wilks’ Lambda p = 0.015). The function coefficients accurately classified all 22 patients into the appropriate survivor subgroup: 9 in the low survival group, 8 in the intermediate survival group, and 5 in the 60+ month survival group. Distribution of DCV survival groups (b) using discriminant analysis of inflammatory cytokines (Wilks’ Lambda p = 0.020). The function coefficients accurately classified the survivor subgroups: 6 in the low survival group, 6 in the intermediate survival group, and 5 in the 60+ month survival group. Distribution of DCV survival groups (c) discriminant analysis using the most powerful discriminators, TGFβ1 and IL17 (Wilks’ Lambda p = 0.003). The function coefficients accurately classified 70.6% (12/17) in the appropriate survivor subgroups: 4 of 6 in the low survival group, 5 of 6 in the intermediate survival group, and 3 of 5 in the 60+ month survival group

