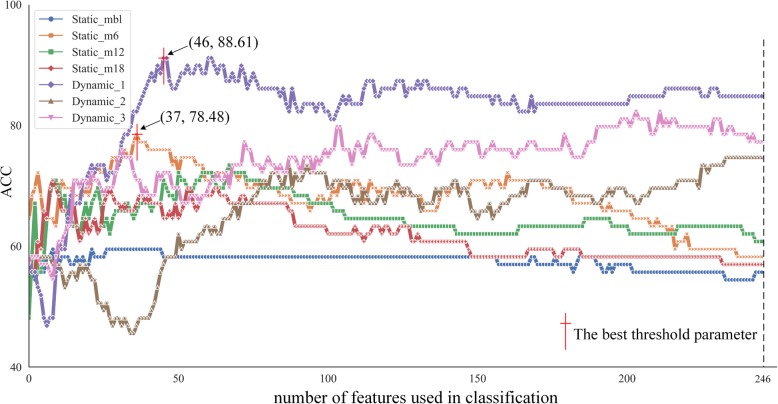
Fig. 2.
The optimization process of classification. The number of selected features increased from 1 to 246 as shown in x-axis. And the y-axis represents the classification performance with static and dynamic features in different colors and markers. ACC, classification accuracy. Static_mbl, static feature obtained in the baseline. Static_m6, static feature obtained in the 6th month after baseline. Static_m12, static feature obtained in the 12th month after baseline. Static_m18, Static feature obtained in the 18th month after baseline. Dynamic_1, dynamic feature calculated with Static_mbl and Static_m6. Dynamic_2, dynamic feature calculated with Static_mbl and Static_m12. Dynamic_3, dynamic feature calculated with Static_mbl and Static_m18

