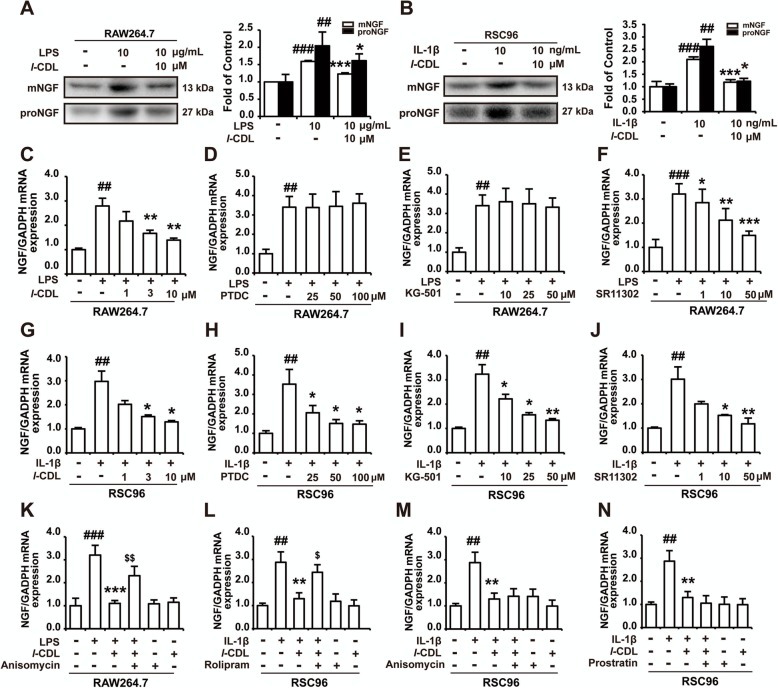
Fig. 7.
l-CDL inhibits AP-1 in macrophages and CREB in Schwann cells to decrease the transcription of NGF. a The expression of mNGF and proNGF after l-CDL (10 μM) treatment of RAW264.7 macrophages that were stimulated with LPS (10 μg/mL) for 12 h. b The expression of mNGF and proNGF after l-CDL (10 μM) treatment of RSC96 Schwann cells that were stimulated with IL-1β (10 ng/mL) for 12 h. c The mRNA level of NGF after l-CDL (1, 3, and 10 μM) treatment of RAW264.7 macrophages that were stimulated with LPS for 12 h. g The mRNA level of NGF after l-CDL (1, 3, and 10 μM) treatment of RSC96 Schwann cells that were stimulated with IL-1β for 2 h (l-CDL was administered 15 min before LPS and IL-1β treatment). b-f The mRNA level of NGF after treatment with the NF-κB inhibitor PDTC, CREB inhibitor KG-501, and AP-1 inhibitor SR11302 in RAW264.7 cells that were stimulated with LPS for 12 h. h-j The mRNA level of NGF after treatment with the NF-κB inhibitor PDTC, and CREB inhibitor KG-501, and AP-1 inhibitor SR11302 in RSC96 Schwann cells that were stimulated with IL-1β for 2 h. k The mRNA level of NGF after coadministration of the AP-1 activator anisomycin (30 μM) and l-CDL (10 μM) in RAW264.7 cells that were stimulated with LPS (10 μg/mL, 12 h). l-n The mRNA level of NGF after coadministration of the CREB agonist rolipram (20 μM), AP-1 activator anisomycin (30 μM), and NF-κB activator prostratin (5 μM) with l-CDL (10 μM) in RSC96 Schwann cells that were stimulated with IL-1β (10 ng/mL, 2 h) (all inhibitors or activators were administered 15 min resepectively before l-CDL treatment). n = 4 per group; #P < 0.05, ##P < 0.01, and ###P < 0.001, compared with the control group; *P < 0.05, **P < 0.01, and ***P < 0.001, compared with the CCI group; $P < 0.05, $$P < 0.01, and $$$P < 0.001, compared with the l-CDL group

