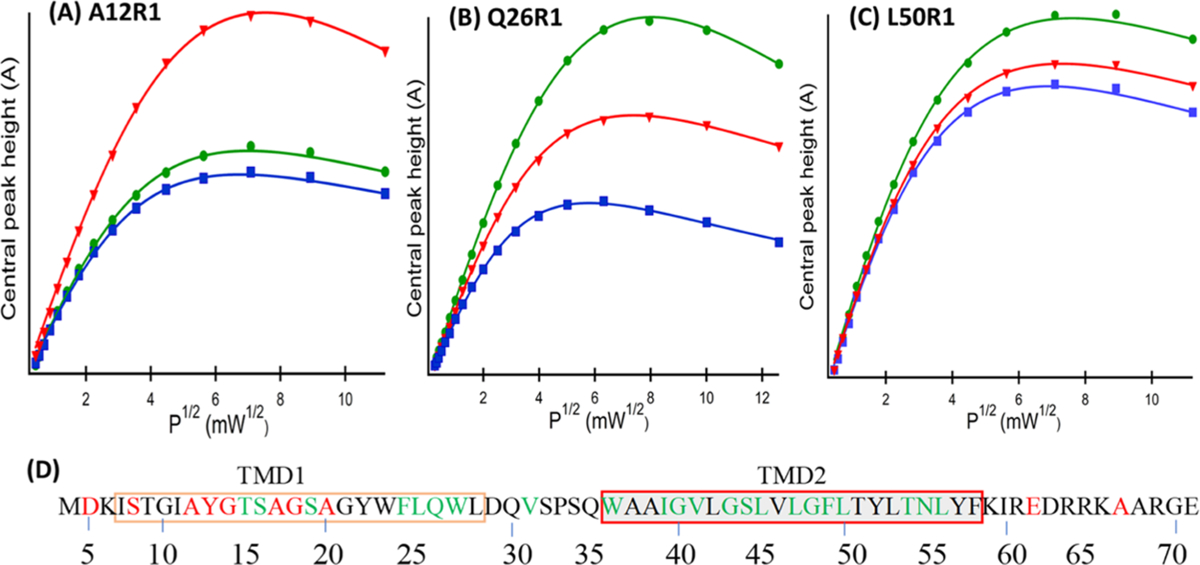
Figure 7.

Representative CW-EPR power saturation curves of S2168 in DMPC proteoliposomes. (A) A12R1 and (B) Q26R1 are in TMD1 and (C) L50R1 is in TMD2. Red triangle represents NiEDDA, green circle represents oxygen, and blue square represents nitrogen spectra with their fitted line from eq 3. The amplitudes of first derivative mI = 0 peak were plotted against the square root of the incident microwave power. (D) Color-coded primary sequence of S2168, where green residues are buried in the lipid bilayer and red residues are solvent-exposed based on CW-EPR power saturation data. Black residues are not studied by the CW-EPR power saturation experiment.
