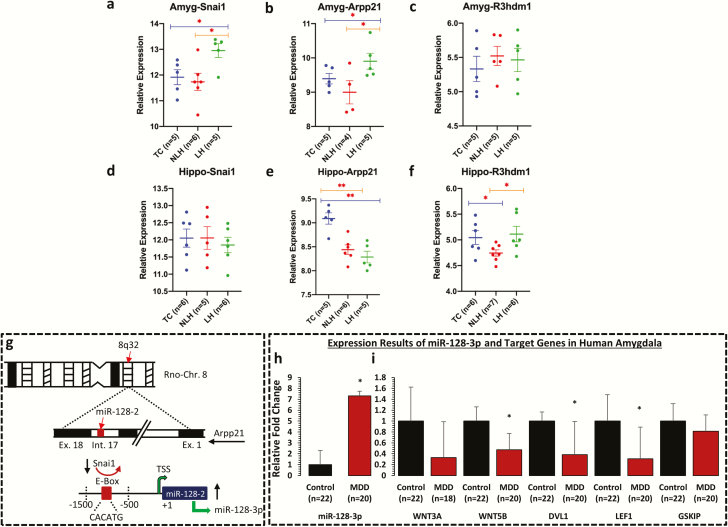
Figure 5.
mRNA expression profile of Snai1, Arpp21, and R3hdm1 in amygdala and hippocampus of LH, NLH, and TC rats and expression profile of miR-128-3p and its target genes in amygdala of MDD subjects. qPCR-based expression changes in Snai1, Arpp21, and R3hdm1 genes in amygdala and hippocampus of LH and NLH groups independently compared with tested controls (TC). All data are Gapdh normalized and presented as the mean ± SEM. (a–c) mRNA-based expression profile in amygdala demonstrated significant changes in Snai1 gene when the LH group was independently compared with the TC (P = .015) or NLH (P = .011) groups. Group comparison between LH and TC rats identified significant changes in expression of Arpp21 (P = .05). Similarly, Arpp21 demonstrated significant change (P = .02) when LH rats were compared with NLH rats. (d–f) In hippocampus, group comparison between NLH and TC rats identified significant change in expression of Arpp21 (P = .001). Comparison between LH and TC rats also identified significant changes in expression of Arpp21 (P < .005). For R3hdm1 gene, group comparison between NLH and TC demonstrated significant difference in expression (P = .02). Significant change in expression was also noted for R3hdm1 (P = .01) when LH rats were compared with NLH rats. (g) Schematic diagram showing the underlying model of miR-128-3p transcriptional regulation being coordinated by transcriptional repressor Snai1 from rat chromosome 8. This zinc finger family transcriptional repressor binds with E-box (CACATG) motif of rat miR-128-2 coding upstream promoter and can impose a repressed state on miR-128-3p expression via Arpp21 intronic axis on chromosome 8. (h) Representative graph demonstrates the relative transcript abundance of miR-128-3p in amygdala of MDD subjects (n = 20) compared with nonpsychiatric control subjects (n = 22). Data are normalized using U6 gene expression values and represented as ±SEM. Level of significance was determined using independent-sample t test (df = 40, f = 13.47, t = 2.01, P = .04). (i) GAPDH normalized relative expression levels of WNT3A, WNT5B, DVL1, LEF1, and GSKIP analyzed in amygdala of MDD subjects. All data demonstrate the mean ± SEM (all genes were analyzed using 22 control subjects and 20 depressed subjects except WNT3A, control = 22 and MDD = 18). The level of significance was determined using independent-sample t test (WNT3A df = 38, f = 0.83, t = −1.75, P = .86; WNT5B df = 40, f = 0.45, t = −2.73, P = .01; DVL1 df = 40, f = 9.63, t = −2.28, P = .03; LEF1 df = 40, f = 0.57, t = −2.25, P = .03; and GSKIP df = 40, f = 0.10, t = −0.68, P = .49). Significance level is indicated with an asterisk sign (*P ≤0.05, **P ≤0.005).

