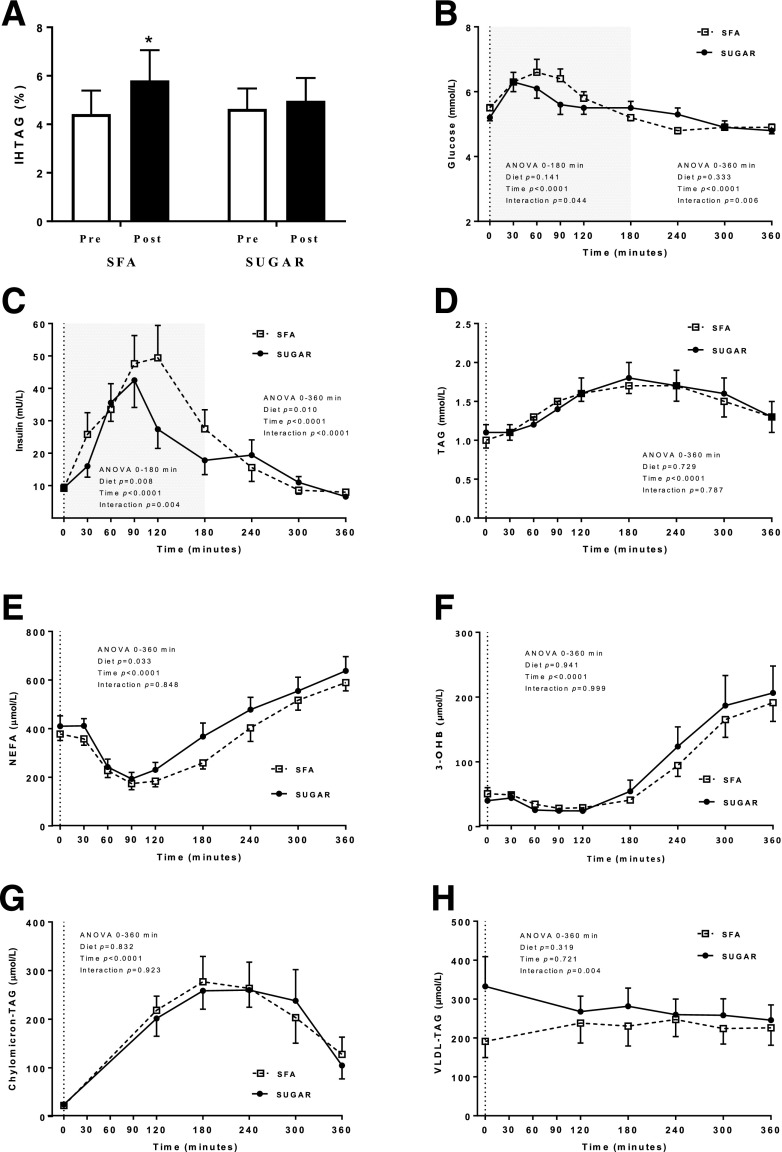
Figure 2.
A: IHTAG percentage before (pre) and after (post) consumption of SFA or SUGAR diet for 4 weeks. Systemic plasma glucose (B), insulin (C), TAG (D), NEFA (E), β-hydroxybutyrate (3-OHB) (F), chylomicron-TAG (G), and VLDL-TAG (H) following a standardized test meal conducted after consumption of SFA or SUGAR diet for 4 weeks. Data are presented are means ± SEM. n = 16 (A–G); n = 13 (H). *P < 0.05 prediet to postdiet. Dotted lines indicate consumption of test meal. Shading on B and C refers to additional statistical analysis performed due to the dynamic glucose and insulin response known to occur during the first 180 min of the postprandial period.

