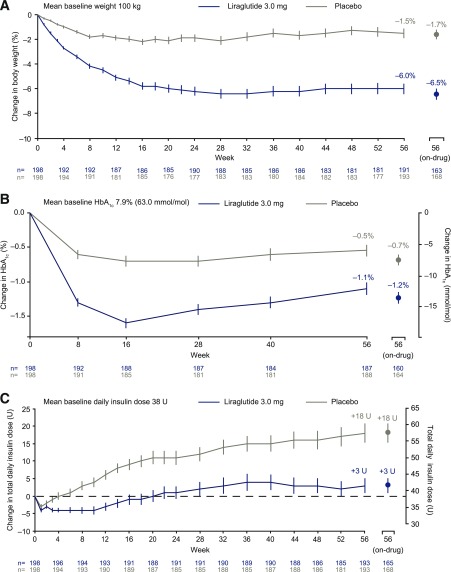
Figure 1.
Change in body weight and glycemic control over time. A: Change in body weight (percentage); observed mean data ± SEM. n values refer to all individuals who attended visit regardless of treatment status; on-drug n values refer to individuals who were still on active treatment at time of visit. B: Change in HbA1c; observed mean data ± SEM. n values refer to all individuals who attended visit regardless of treatment status; on-drug n values refer to individuals who were still on active treatment at time of visit. C: Change in total daily insulin dose; graph shows observed mean data ± SEM. n values refer to all individuals who attended visit regardless of treatment status; on-drug n values refer to individuals who were still on active treatment at time of visit. U, units.

