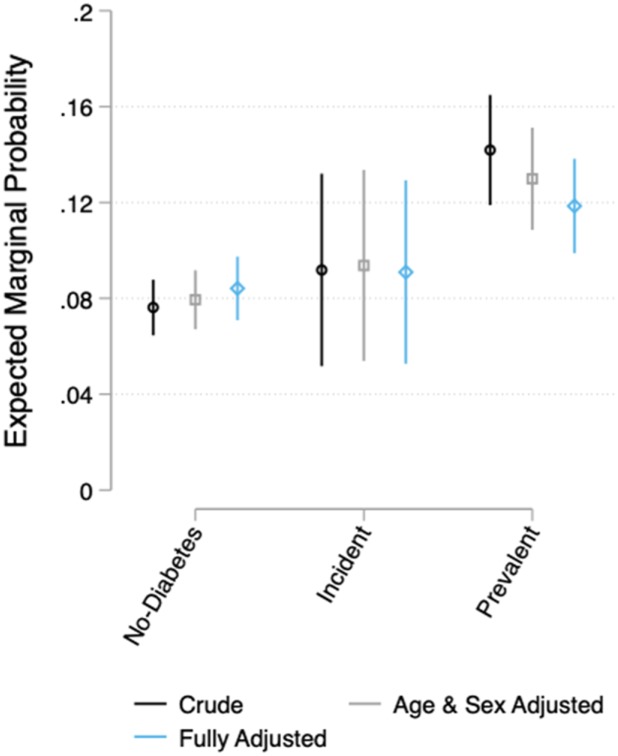
Figure 2.
Estimates of crude and adjusted marginal probability (and their 95% CIs) of MCI. Results are derived from survey logistic regression models. Prevalent diabetes, since visit 1; incident diabetes, at visit 2. Adjusted models correct for Latino background (six groups), sex, age, education (<12 years, 12 years, >12 years), language preference (English, Spanish), whether someone is a current smoker (0 = no, 1 = yes), a dichotomous indicator for alcohol consumption (one or more drinks per day), self-reported prevalent stroke or TIA, myocardial infarction, BMI based on weight measured in kilograms and height measured in centimeters, and ≥10 on CESD-10. With the exception of age, all covariates were measured at baseline.

