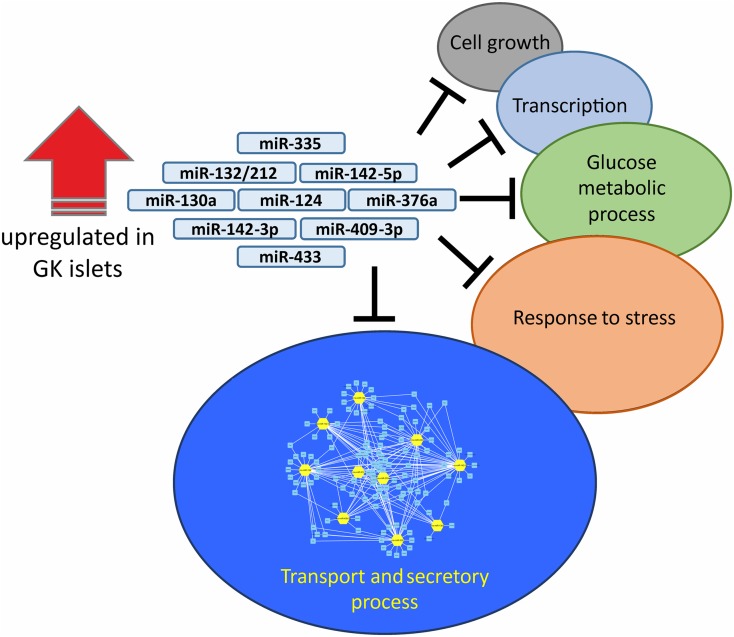
Figure 2.
The collective predicted mRNA targets of upregulated miRNAs in the GK islets were filtered to include only glucose-regulated genes and were subjected to GO enrichment analysis (18). The miRNA-mediated negative regulation of genes within each term is exemplified by the black “T” symbol. Among the genes within enriched GO terms, the majority belong to transport and secretory processes; the unique network (created in Cytoscape, version 3.7.2 [75]) in which the 10 miRNAs (yellow hubs) negatively regulate target genes (light blue nodes) is shown.

