Figure 1.
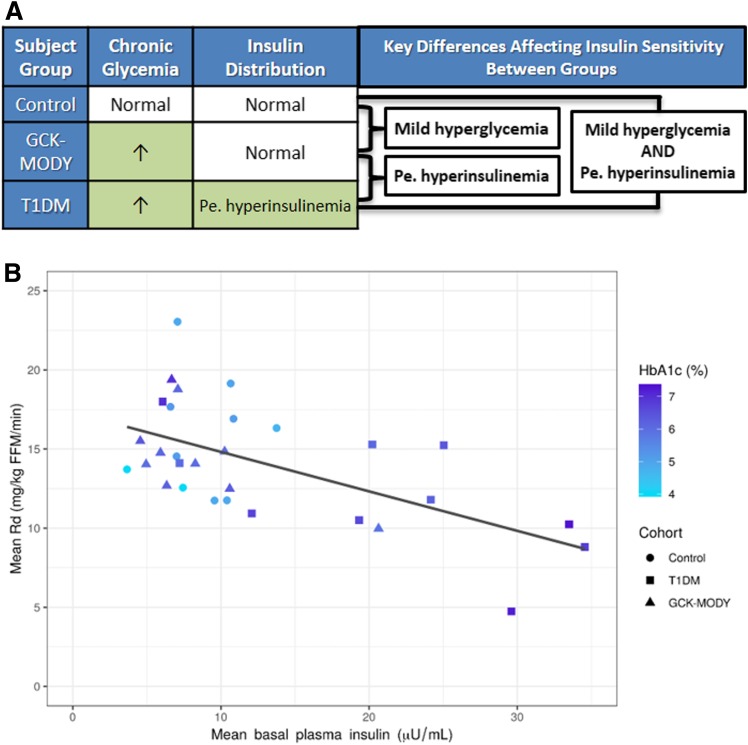
A: Key differences and similarities in chronic glycemia and insulin distribution affecting insulin sensitivity between participant groups. Pe. hyperinsulinemia, peripheral hyperinsulinemia. B: Scatterplot depicting correlation between mean basal insulin concentration (x-axis), glycosylated hemoglobin (HbA1c, darker shade of blue represents higher HbA1c), and mean rate of glucose disposal (Rd) during hyperinsulinemic, euglycemic clamp. Insulin was infused at 40 mU/m2/min when Rd was measured. The figure shows that participants with type 1 diabetes (T1DM) (squares) had higher basal insulinemia (further to the right on the x-axis), higher chronic glycemia (darker shade of blue), and lower Rd (further down on the y-axis). GCK-MODY participants (triangles) had glycemia similar to that of T1DM participants (similar shade of blue) but lower insulinemia (further to the left on the x-axis) and higher Rd (further up on the y-axis). Despite having differing glycemia (differing shades of blue), GCK-MODY and control (circles) participants generally had lower and similar insulinemia and higher Rd than T1DM participants. Coefficient of determination (R2) between basal insulin concentration and Rd was 0.36. R2 between HbA1c and Rd was 0.09. R2 for the multivariable linear regression model including both basal insulin concentration and HbA1c as dependent variables and Rd as an independent variable was 0.36. Thus, these linear regression analyses show that insulinemia alone explained 36% of the variance in Rd, a factor that was virtually unchanged with the addition of chronic glycemia in multivariable linear regression analysis. Collectively, these data suggest hyperinsulinemia stemming from peripheral insulin delivery plays a far greater role than hyperglycemia in causing peripheral insulin resistance in type 1 diabetes. FFM, fat-free mass.

