Figure 4.
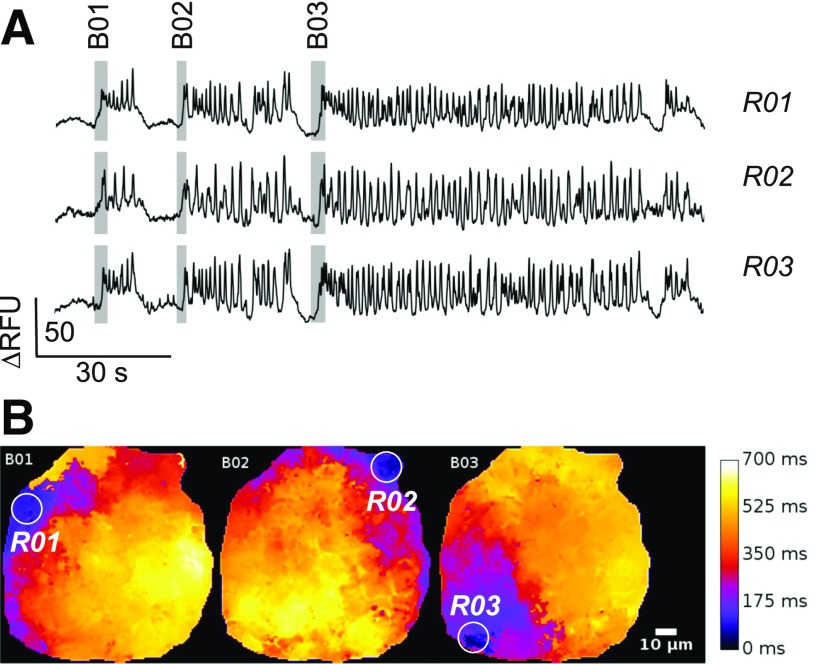
No evidence of hub cells from optical imaging of β-cell electrical activity. A: Electrical activity in three regions (R01–R03) within an islet expressing the membrane potential sensor Optopatch2. Responses are shown as the changes in relative fluorescence units (RFU). The gray rectangles superimposed on the traces highlight three successive bursts of electrical activity (B01–B03). B: Spread of electrical activity across the islet. The delay with respect to the first point at which electrical activity was detected is displayed in pseudocolors with black corresponding to no delay and white to delay of 700 ms. Note that bursts B01, B02, and B03 are initiated in three different spatially separated areas of the islet (R01–R03: white circles). The measurements in A were taken from these regions.

