Figure 5.
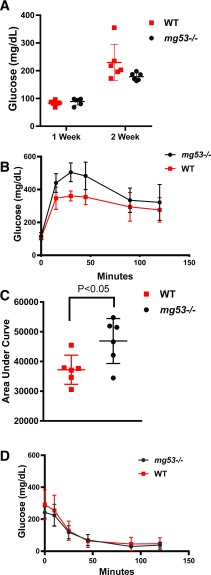
mg53−/− mice show compromised glucose handling following STZ administration. A: Fasting blood glucose levels were measured at 1 and 2 weeks following the last dose of STZ injection. B: GTT was conducted at 2 weeks post-STZ. Significant differences were measured at 30 and 45 min (P = 0.002 and 0.008, respectively). C: AUC measurement of B revealed significant differences between WT and mg53−/− mice (P = 0.025). D: Three weeks post-STZ, ITT measurement revealed no significant difference between WT and mg53−/− mice.

