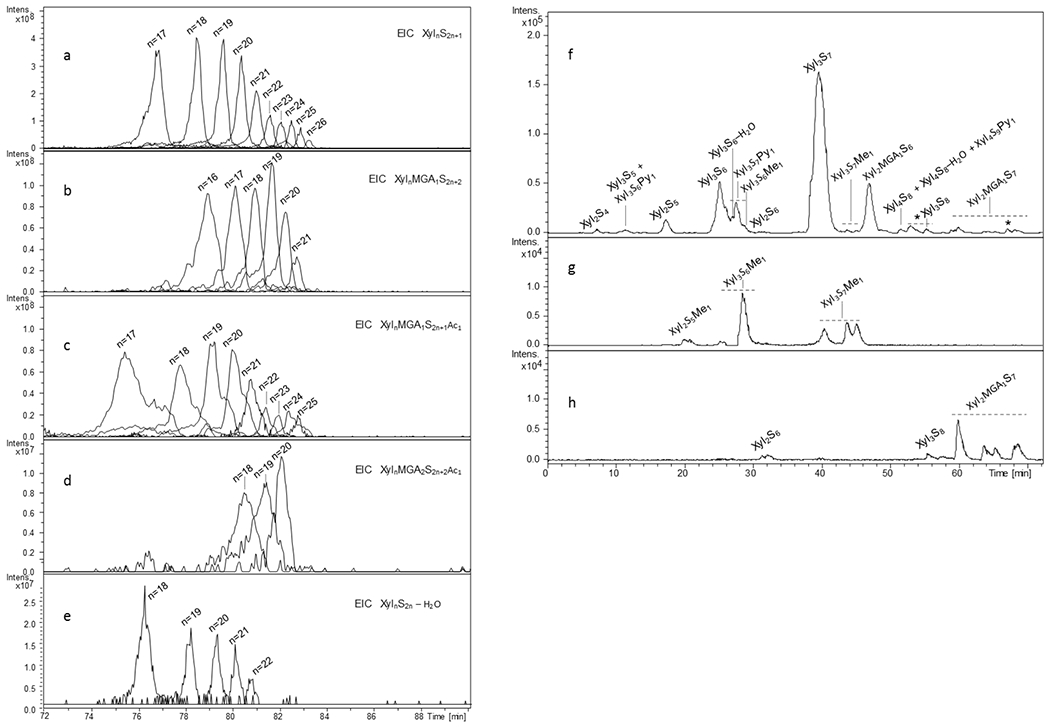
Fig.3.

LC-MS profiles of different structural families of PPS detected in high molecular weight (a-e) and low molecular weight (f-h) fractions of PPS by LC/ESI-FT-MS
(a) – EIC of XylnS2n+1 structures (n: 17-16), (b) –EIC of XylnMGA1S2n+2 structures (n: 16-21), (c) – EIC of XylnMGA1S2n+1Ac1 structures (n: 17-25), (d) – EIC of minor XylnMGA2S2n+2Ac1 structures (n: 18-20), (e) - XylnS2n-H2O structures (n: 18-22) , (f) basepeak chromatogram of a small size (dp 3) fraction of PPS, (g) and (h) - EIC profiles of some minor methylated and completely sulfated components, respectively
m/z values used for obtaining EIC profiles are those of the most abundant ion form reported in Tables S2 and S3 Xyl – xylose repeating unit, MGA – branching 4-O-methyl-glucuronic acid, S – sulfate group, Py – pyridine moiety, Me – methyl group
