
Figure 1.
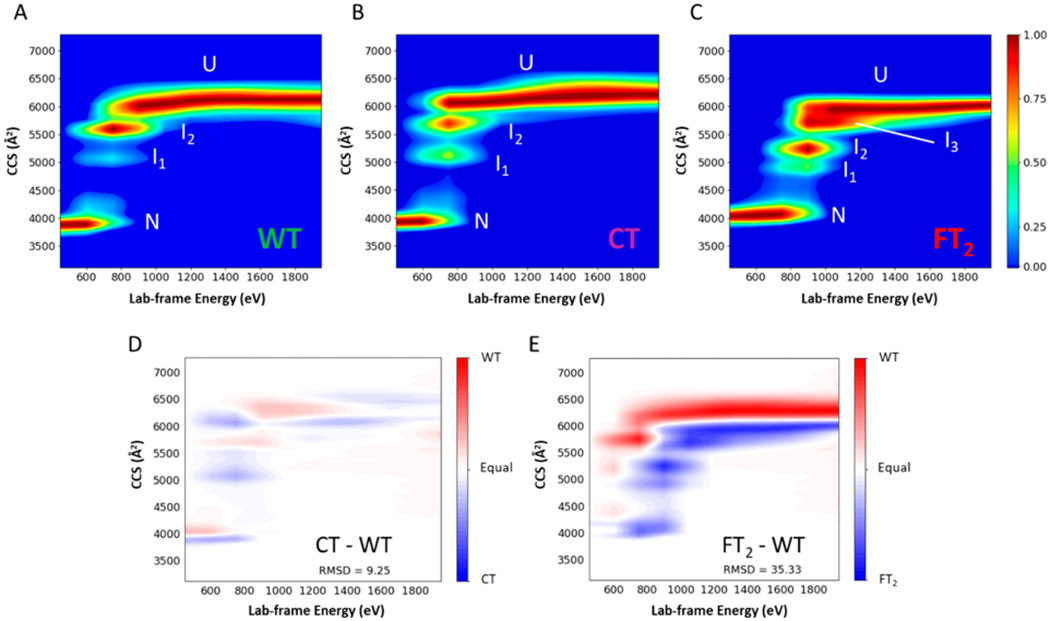
Different gas-phase stabilities and intermediates were observed for TTRs (untagged and tagged) in the gas phase. Lab-frame energy is plotted versus the collision cross section (CCS) of (A) WT-TTR (B) CT-TTR, and (C) FT2-TTR (15+) in 200 mM ammonium acetate at 25 °C. Difference CIU plot obtained from te subtraction of (D) CT-TTR and WT-TTR and (E) FT2-TTR and WT-TTR after adjustment of the CCS value of the native conformer of WT-TTR to match the CCS value of the native conformer of CT-TTR or FT2-TTR. CIU plots of WT- and CT-TTR are similar in terms of the number of intermediates and the relative energy required for unfolding at each step (see text for more detail), whereas FT2-TTR shows a third intermediate and different unfolding energies.