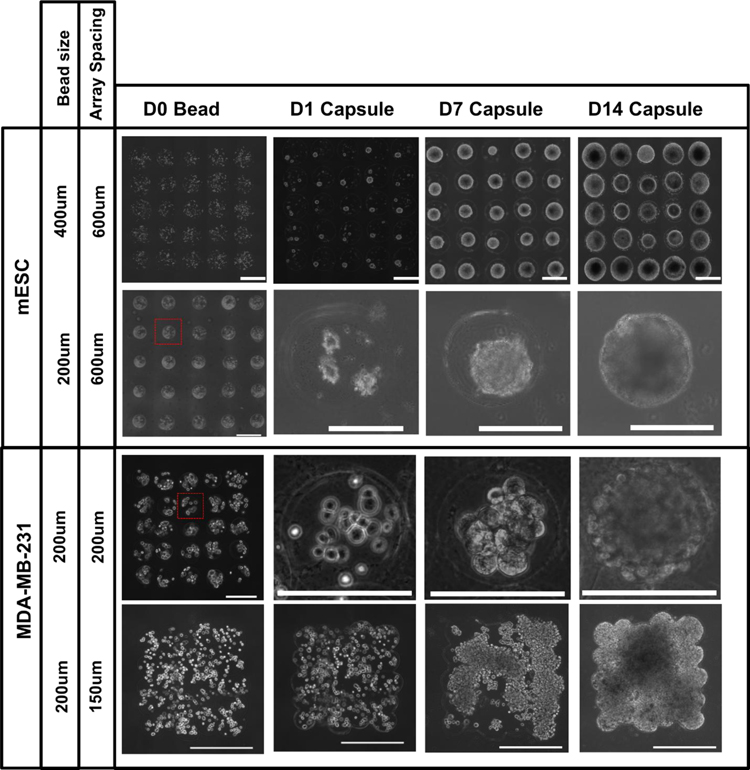
Figure 5:
Representative images of various print configurations of microbeads (5x5 array and rectangular mat) at day 0, at 1, 7 and 14 days after their processing into a core-shelled structures. Over the 14-day period, both stem cells (upper rows) and tumor cells (lower rows) formed single aggregates which grew to fill the volume of each core-shelled structure. Scale bars are 500 μm (rows 1and 4) and 200 μm (row 2 and 3).

