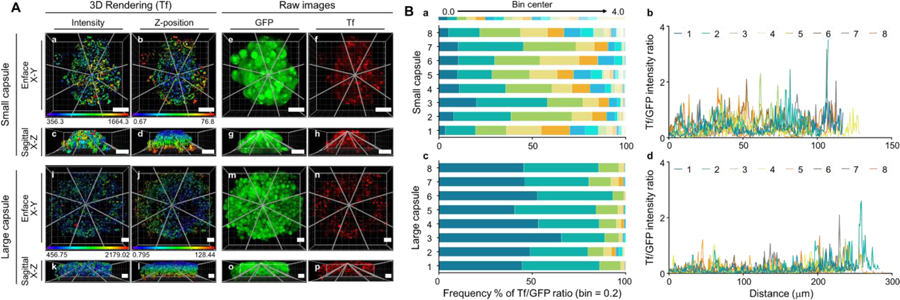
Figure 9:
3D rendering of Tf-containing endocytic structures using Imaris “surface” module in cells expressing GFP. Panel A: Tf-containing 3D rendered structures display mean intensity values (a, c, I, k) and z-position (b, d, j, l) in aggregates with GPF-cytosolic staining (e, g, m, o) to indicate the presence of cells expressing GFP, and Tf fluorescence intensity to indicate Tf uptake (f, h, n, p). The 8 lines (gray lines) across Tf-containing endocytic structures are shown for the smaller and larger aggregates. Scale bar: 50 m. Panel B: In panels a and c, heat maps of frequency % of Tf/GFP ratios are shown for large and small capsules, respectively. In panels b and d, Tf/GFP intensity ratio vs. distance ( m) charts are shown using the Imaris “line intensity” module.

