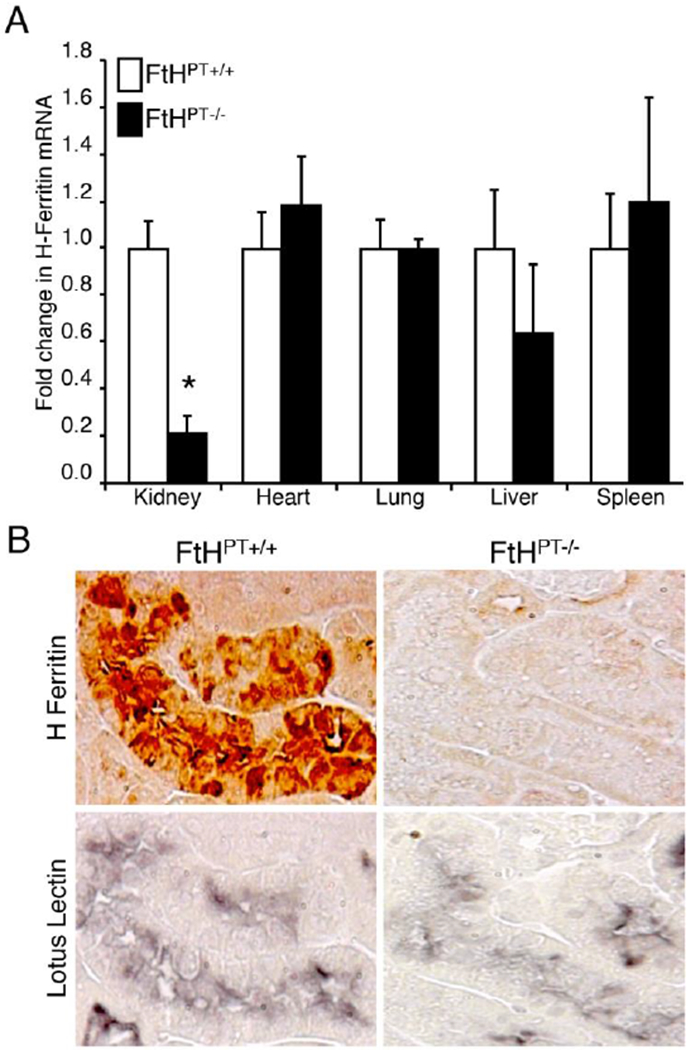
Figure 1. Ferritin expression in the kidney.

(A) Real-time PCR was used to analyze FtH mRNA expression in the organs of wild-type (FtHPT+/+) and proximal tubule specific FtH deletion mice (FtHPT−/−). Results were normalized to GAPDH and expressed as fold change compared with FtHPT+/+ Data are mean ± SEM. *P < 0.001 vs. FtHPT+/+. (B) Immunohistochemical staining on serial kidney sections from FtHPT+/+ and FtHPT−/− mice for FtH and the proximal tubule marker, lotus lectin. Reproduced with permission.28
