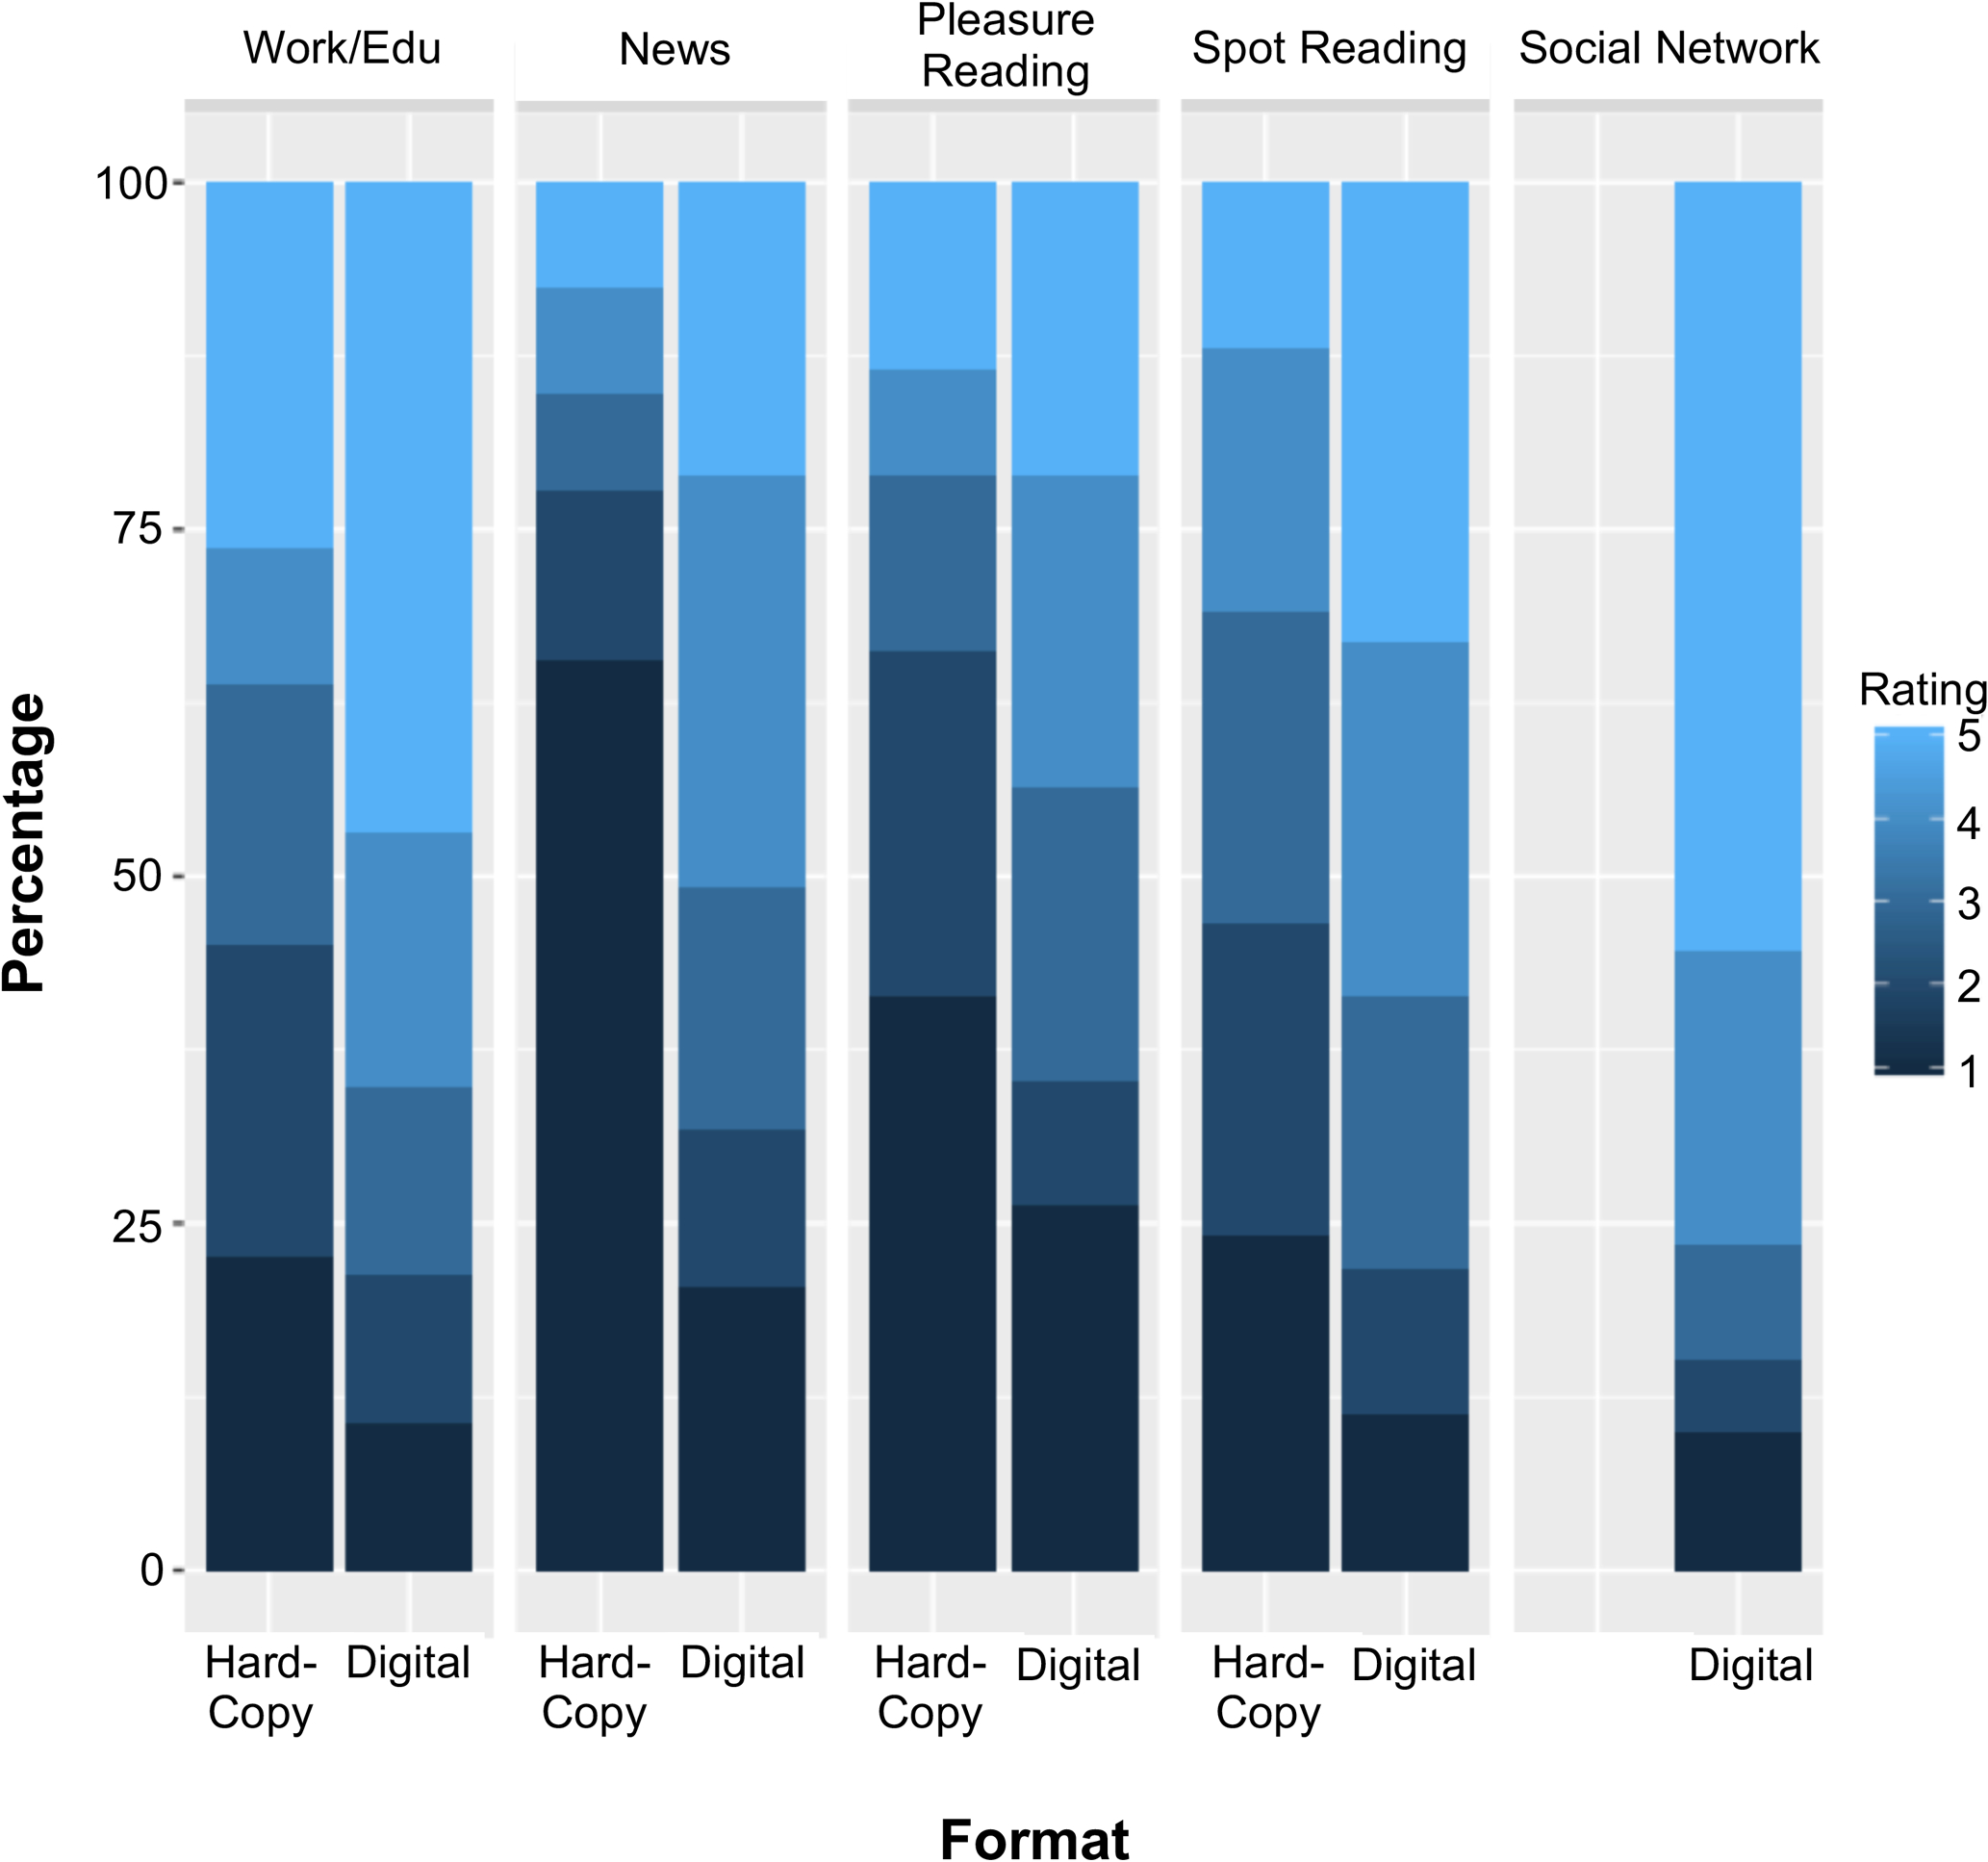
Figure 3.

The stacked bar plot shows the percentage of participants providing each of the ratings from 1 to 5 on the y-axis. The x-axis represents the five activities listed in the survey with separate bars for Hard-Copy and Digital reading. The darker color represents lower rating, which refers to less time spent on a specific activity.
