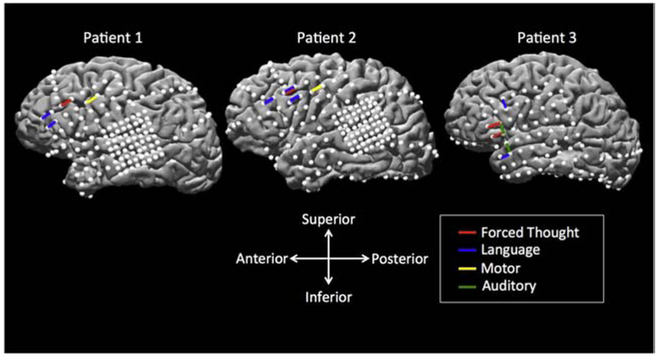
Figure 1. Electrode localization on the reconstructed brain surface from each individual patient’s MRI, with left hemispheric coverage.
Surface electrodes are represented by white dots. Bipolar stimulation across electrode pairs which elicited forced thoughts are shown as red bars and are located in the prefrontal cortex. Adjacent electrode pairs which elicited a functional response during electrocortical stimulation mapping (ESM) are shown in blue (language), yellow (motor), and green (auditory). Patients 1 and 2 had a combination of a standard subdural grid (2.3 mm diameter, 10 mm center-center interelectrode distance), pediatric grid (2.3 mm diameter, 5 mm center-center interelectrode distance), and strips (2.3 mm diameter, 10 mm center-center interelectrode distance. Patient 3 has a combination of a standard subdural grid and strips.

