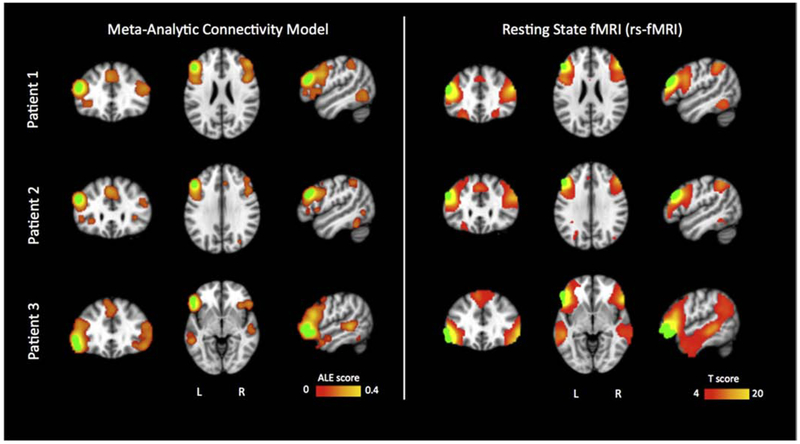
Figure 2.
Comparison of co-activated networks between Meta-Analytic Connectivity Model (MACM) and rs-fMRI. Subject elliptical ROIs were marked in green color. Rs-fMRI connectivity one sample t-test showed significant effect in bilateral frontal gyri and temporal gyri, t(80)=3.67, p<0.001. Meta-Analytic Connecitivity Models (MACM) reported Activation Likelihood Estimation (ALE) scores significant at cluster-level (<0.001) and False Discovery Rate (p<0.05) thresholds. These MACM-defined areas mirror those reported by rs-fMRI. Patient 1 is shown at MNI152 x,y,z slices (−50,32,24); Patient 2 is shown at (−49,28,30); Patient 3 at (−53,21,−5).

