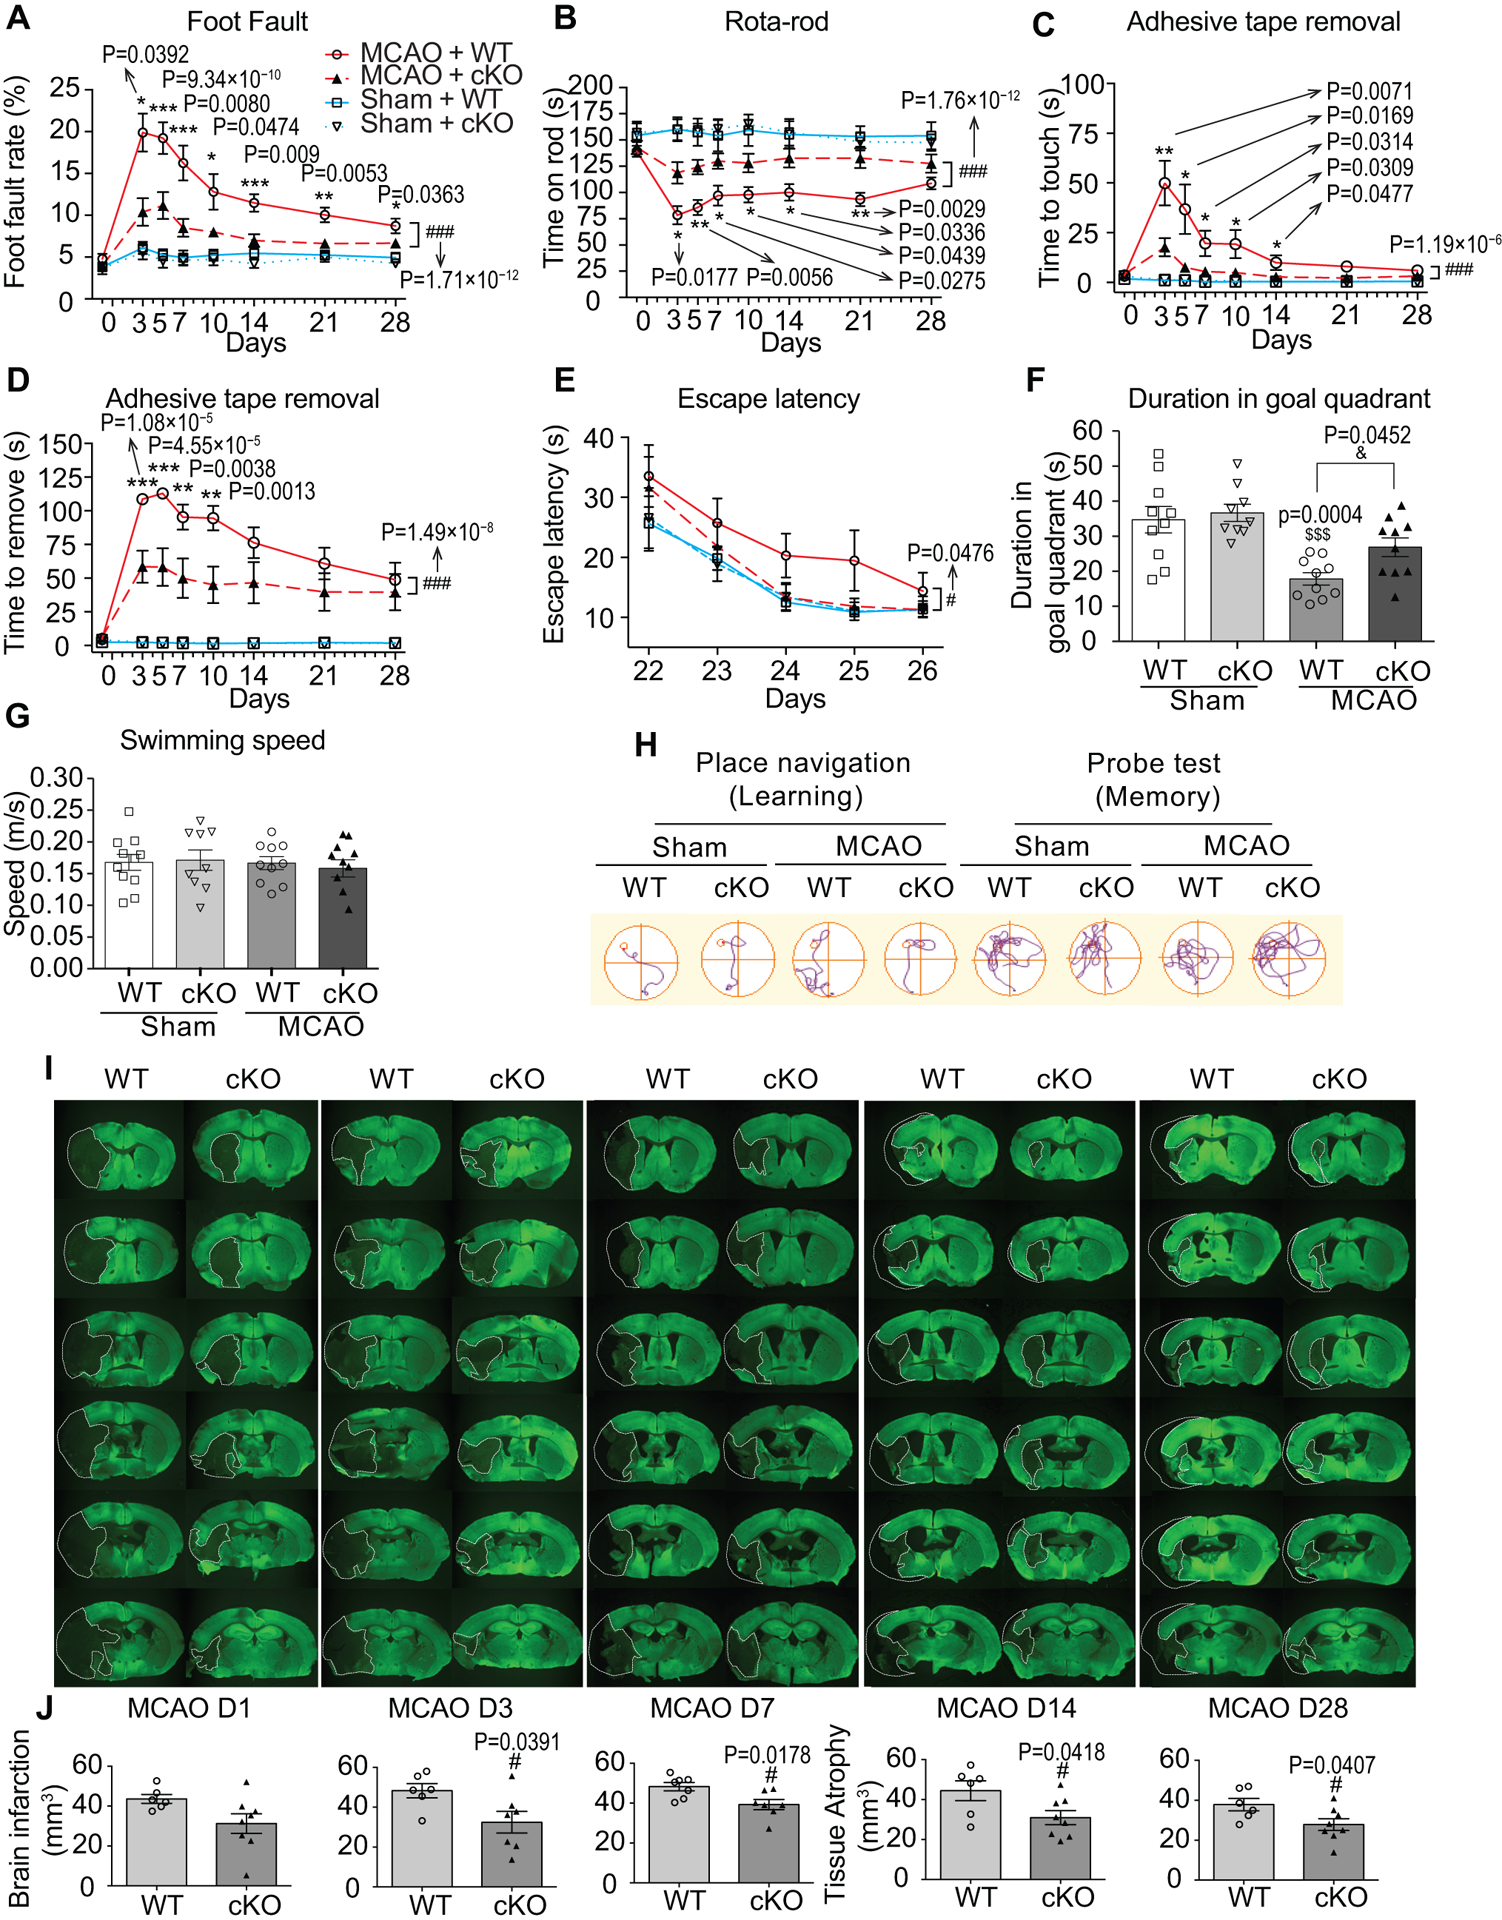
Fig. 2. Endothelium-targeted miR-15a/16–1 deletion improves sensorimotor and cognitive outcomes, and attenuates brain infarction and atrophy after cerebral ischemia.

A-D, Sensorimotor deficits were assessed 1 d before and up to 28 d after MCAO by foot fault test (A), rota-rod test (B), and adhesive tape removal test (C, time to touch the tape and D, time to remove the tape). EC-miR-15a/16–1 cKO mice exhibited statistically significantly less sensorimotor deficits and better neurological recovery than WT controls after MCAO. n = 13–14 for MCAO + WT and MCAO + cKO groups; n = 10 for Sham + WT and Sham + cKO groups. *p < 0.05, **p < 0.01, ***p < 0.001 between MCAO + WT and MCAO + cKO groups by one-way ANOVA followed by Tukey’s multiple comparison tests (individual time point); ###p < 0.001 between MCAO + WT and MCAO + cKO groups by two-way ANOVA followed by Bonferroni’s multiple comparison tests (bracket); Kruskal-Wallis test followed by Dunn’s post hoc analysis was performed for Foot Fault test at 3 d time point in A. E-H, Long-term cognitive functions were assessed by the Morris water maze, showing that EC-miR-15a/16–1 cKO mice exhibited better learning and memory abilities than WT controls after ischemic stroke. E, The time for the animals to locate the submerged platform (escape latency) was measured at 22–26 d after MCAO. F, Spatial memory was evaluated at 27 d after MCAO by measuring the time spent in the goal quadrant when the platform was removed. G, Gross locomotor functions was measured by average swim speed. H, Representative swim path for different experimental groups. n = 10 for MCAO + WT and MCAO + cKO groups; n = 9–10 for Sham + WT and Sham + cKO groups. #p < 0.05 between MCAO + WT and MCAO + cKO groups by two-way ANOVA followed by Bonferroni’s multiple comparison tests (bracket). $$$p < 0.001 versus Sham + WT group, &p < 0.05 as indicated by one-way ANOVA followed by Tukey’s multiple comparison tests. I, J, brain infarction and atrophy were also measured and quantified by using MAP2 (green) immunostaining at 1–28 d reperfusion following MCAO. Dashed lines outline the brain infarction or atrophy. Representative MAP2 immunofluorescent images (I), and quantitative analysis (J) showing that EC-miR-15a/16–1 deletion statistically robustly down-regulated brain infarction at 3–7 d after MCAO, and reduced brain atrophy at 14–28 d following MCAO compared to WT controls. n = 6–8 for each group; #p < 0.05 versus MCAO + WT group; statistical analyses were performed by two-tailed Student’s t-test.
