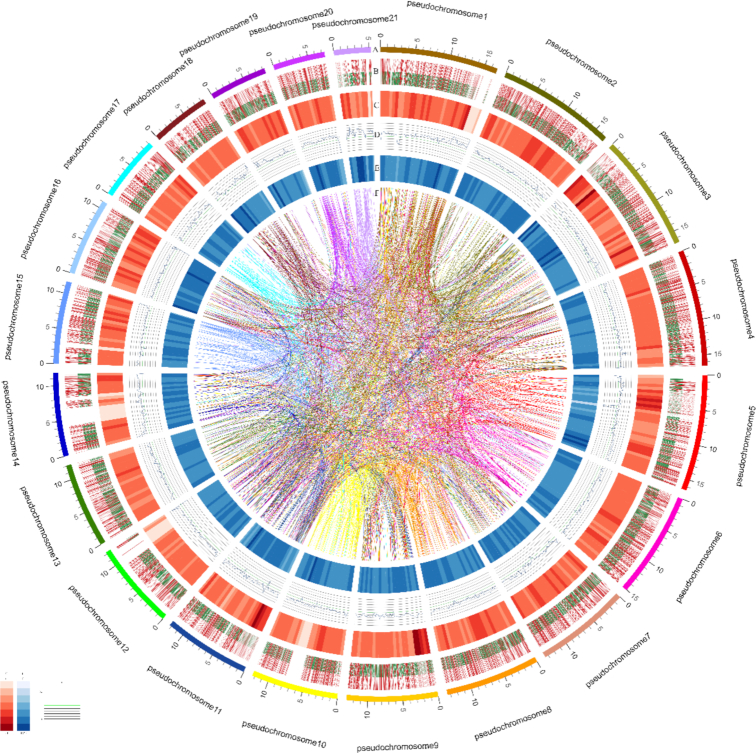
Figure 2:
Schematic representation of the genomic characteristics of R. esculentum. Track A: 21 pseudochromosomes of R. esculentum genome (Mb). Track B: Protein-coding genes present in the scaffolds. Red represents genes on forward strand, and green, genes on reverse strand. Track C: Distribution of gene density with sliding windows of 1 Mb. Higher density is shown in darker red color. Track D: Distribution of GC content in the genome. Track E: Distribution of repeats in the genome. Track F: Schematic presentation of major interchromosomal relationships.

