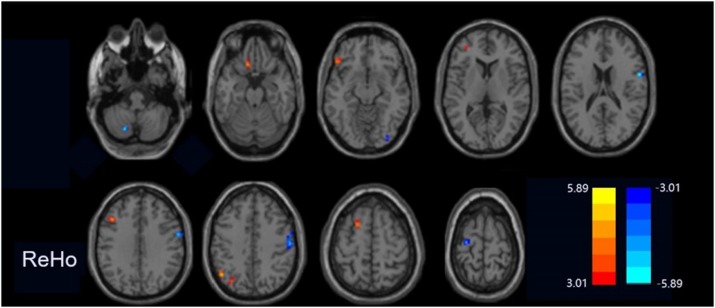
FIGURE 2.
Regions exhibiting differences in ReHo between peripartum depression and healthy postpartum women (p < 0.005 corrected by FDR). The warm colors represented the significance of higher ReHo values and the cool colors represented the significance of lower ReHo values for the group comparisons.

