Fig. 6.

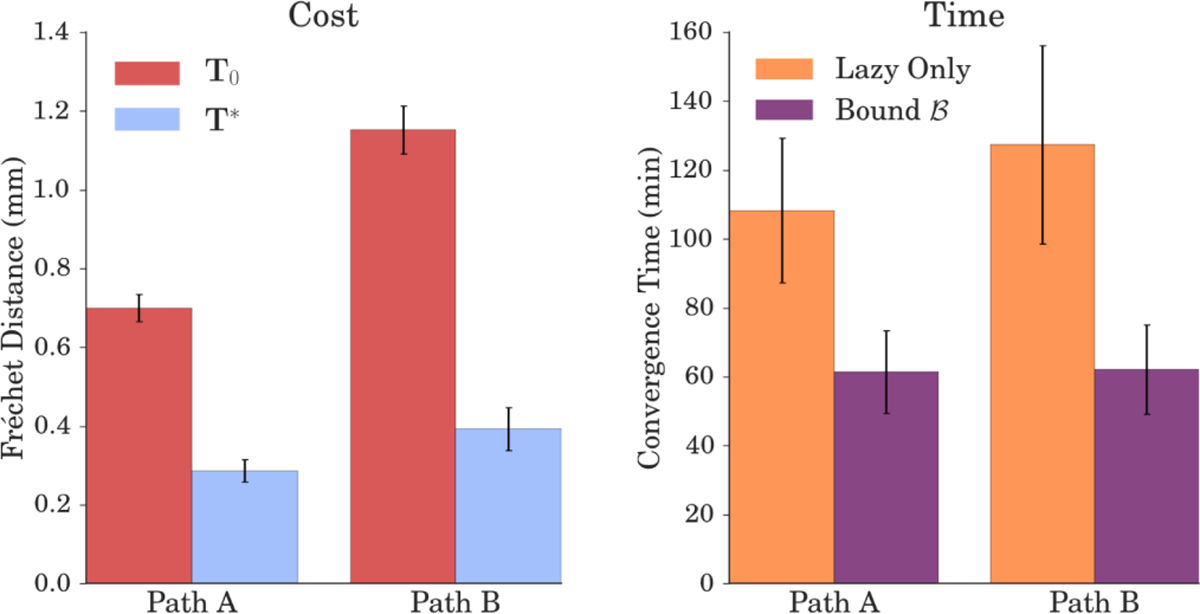
At left, we compare the costs for each path using the initial insertion pose T0 (red) and the final insertion pose T* (blue). At right, we report convergence times for each path with (purple) and without (orange) use of the bound .

At left, we compare the costs for each path using the initial insertion pose T0 (red) and the final insertion pose T* (blue). At right, we report convergence times for each path with (purple) and without (orange) use of the bound .