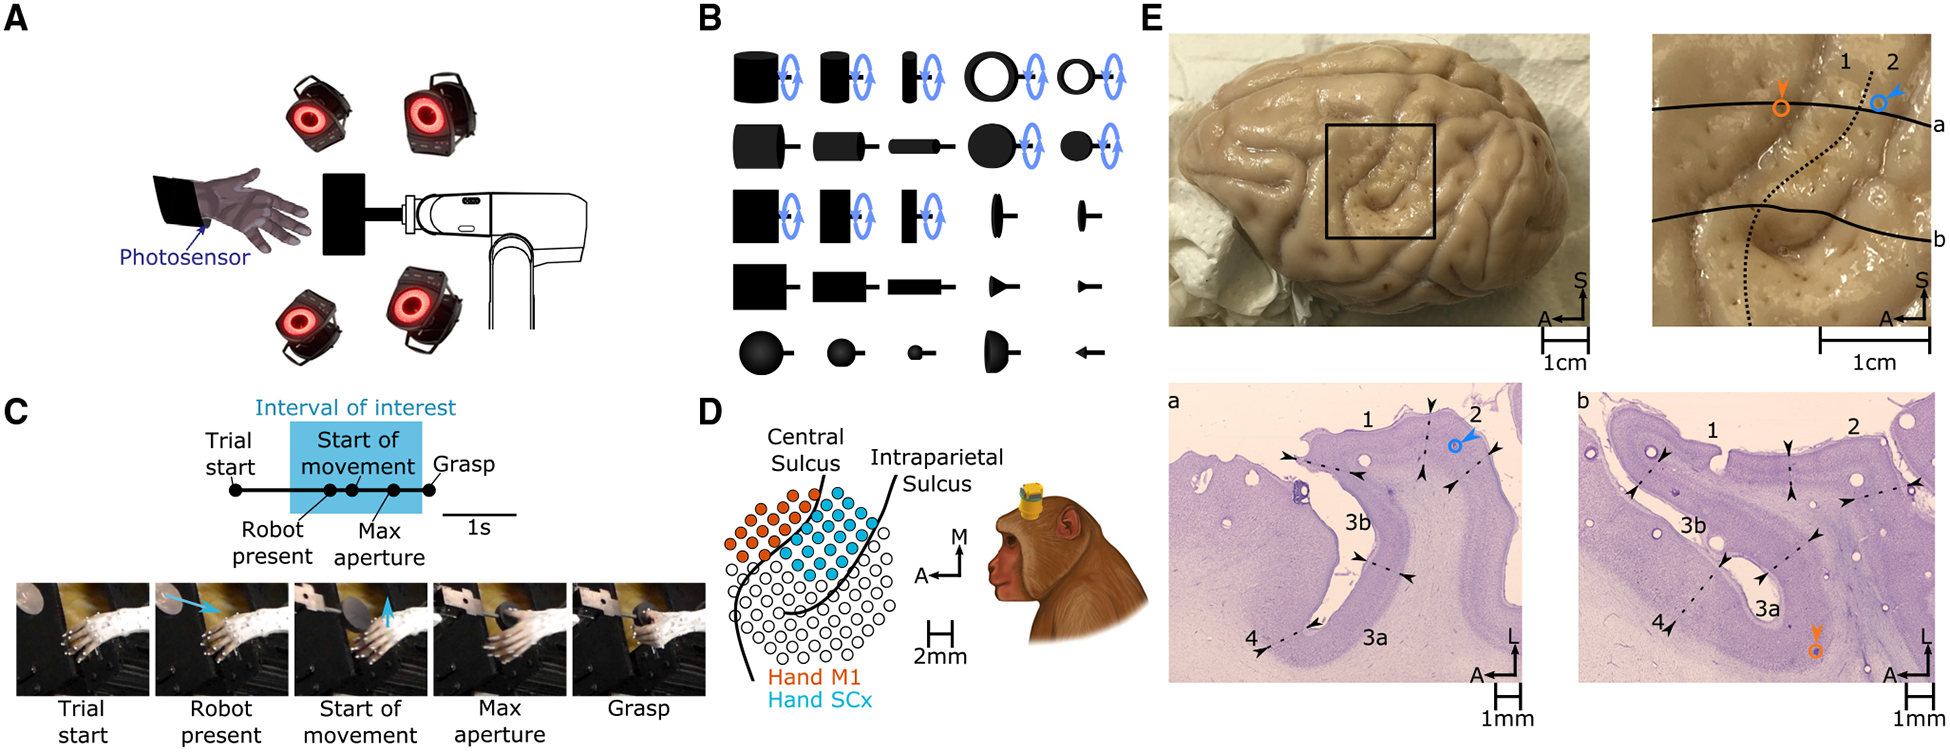
Figure 1. Experimental Methods and Histology.

(A) Rhesus macaques grasp objects presented by a robotic arm. When the monkey lifts its arm to reach for the object, a photosensor is triggered, and the trial is aborted. A fourteen-camera motion-tracking system tracks the kinematics of the hand.
(B) The set of 25 shapes used in this study. Ten of these shapes (indicated by a blue circular arrow) were presented at different orientations, totaling 35 “objects.”
(C) Task progression. “Start of movement,” “Max aperture,” and “Grasp” were identified for each trial. Blue arrows indicate the motion of the robot (“Robot present”) or the hand (“Start of movement”). Analyses were confined to neural responses measured prior to “Grasp” (spanning the “Interval of interest”) to eliminate the confounding effects of object contact.
(D) Multi-electrode arrays were used to record neuronal activity. Pictured on the left are the reconstructed locations of electrodes relative to the surface of the cortex (left hemisphere) in monkey 4. See Figure S1 for array placements in other monkeys.
(E) Histological reconstruction of array placement. Top left: chronically implanted electrode tracks were clearly visible in the perfused cortex. Top right: enlarged view of the rectangular region at the top left. Registered to this view of the cortical surface are the architectonic boundary between areas 1 and 2 (dashed line), the locations of two electrodes impinging on areas 2 (blue) and 3a (orange), and the contours of the cortex along two horizontal slices pictured at the bottom (solid lines). Bottom: transverse slices are stained for Nissl substance, and boundaries between cortical fields are drawn on the basis of architectonic features. In scale bars, S indicates superior, A indicates anterior, and L indicates lateral.
