
Fig. 1.
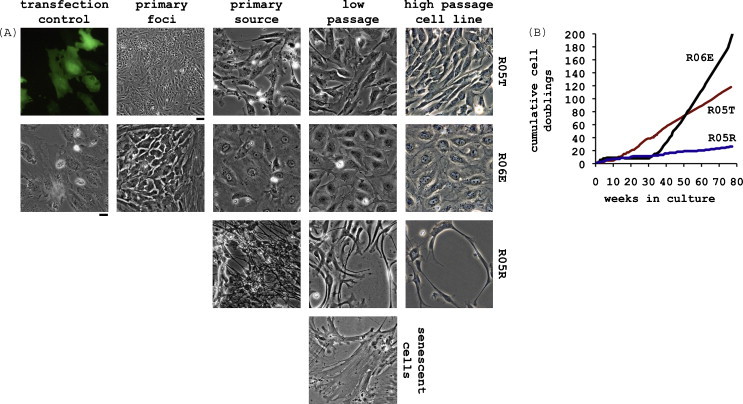
Cell line generation and passage diagram. (A) GFP positive control in upper panel demonstrating transfection rate in primary Rousettus cells in the first column (scale bar is 20 μm for all images with 20× initial magnification). Foci of immortalized cells still embedded in monolayers of primary cells is shown in the second column (scale bar is 100 μm). Source primary cultures for three cell lines are shown in the third column. Within 10 passages primary cells undergo senescence and are lost leaving low passage cell lines (shown here at week 40) that at low confluency in appearance are surprisingly similar to the source. There are also only few changes in phenotype after 80 weeks of continuous culture. (B) Passage diagram demonstrating stable proliferation rates with a doubling time of approximately 50 h for R05T (after a lag phase of 10 weeks) and 120 h for R05R. R06E cell line exhibits a long lag phase for 30 weeks and thereafter sudden increase in doubling time to approximately 24 h.