
Fig. 5.
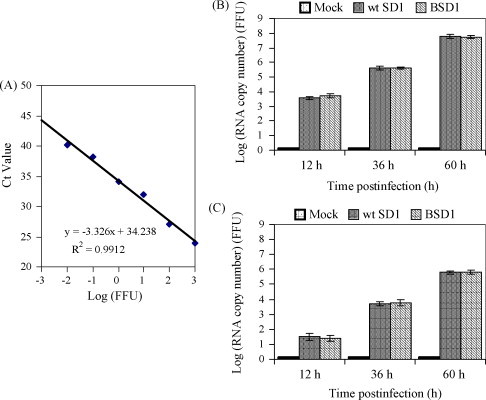
Viral RNA quantitation of BSD1 with SYBR-green quantitative RT-PCR in a time course analysis. (A) Standard curve of quantitative RT-PCR of viral RNA in infected MDBK cells. Ct values were plotted against the log of a known amount of BVDV strain SD1 (FFU). Quantitation of viral positive RNA (B) and negative RNA (C) strands. For both panels, MDBK cells were infected with BSD1 or wt SD1 as well as mock-infected MDBK cells as a negative control. Cells were harvested at indicated time points, total cellular RNAs were isolated, and viral positive and negative RNA content were determined. Error bars represent the standard deviation for three independent experiments.