
Fig. 6.
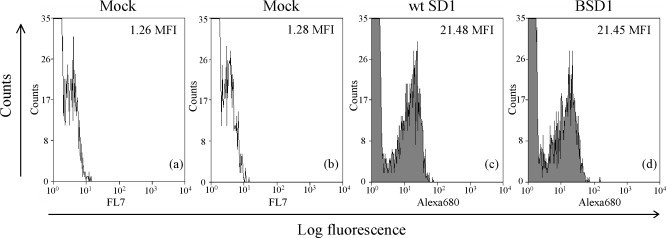
Comparison of viral E2 protein expression between BSD1 and wt SD1. MDBK cells were infected with BSD1 or wt SD1 as well as mock-infected MDBK cells as negative controls. At 60 h p.i., cells were immunostained and the fluorescence intensity of the cells was determined by flow cytometry at a detection spectrum of 698 nm. E2 protein expression was reflected by mean fluorescence intensity (MFI) of the E2-positive cells and indicated in each panel. (a) Mock-infected MDBK cells; (b) Mock-infected MDBK cells incubated only with secondary antibody; (c) wt SD1-infected MDBK cells; (d) BSD1-infected MDBK cells.