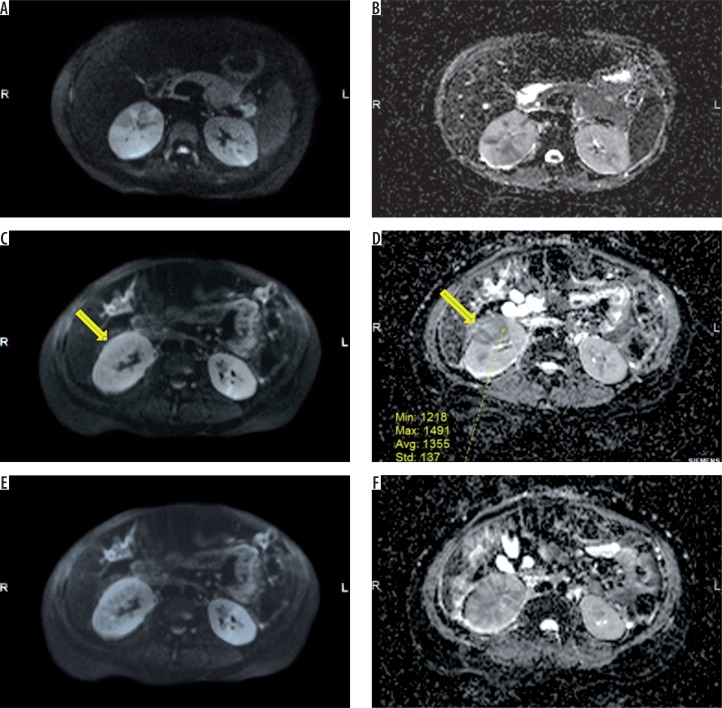
Figure 3.
Acute right pyelonephritis. Axial diffusion-weighted (DW) imaging sequences at three levels (A, B – upperpole, C, D – midpole, E, F – lower pole) in the right kidney reveal heterogeneously hyperintense lesions with corresponding hypointense signal in ADC map. The mean ADC of one of the inflammatory foci (arrows) in midpole is 1355 × 10-6 mm2/s (D). The involvement of lower pole in this patient was subtle on contrast-enhanced computed tomography but obvious on DW imaging

