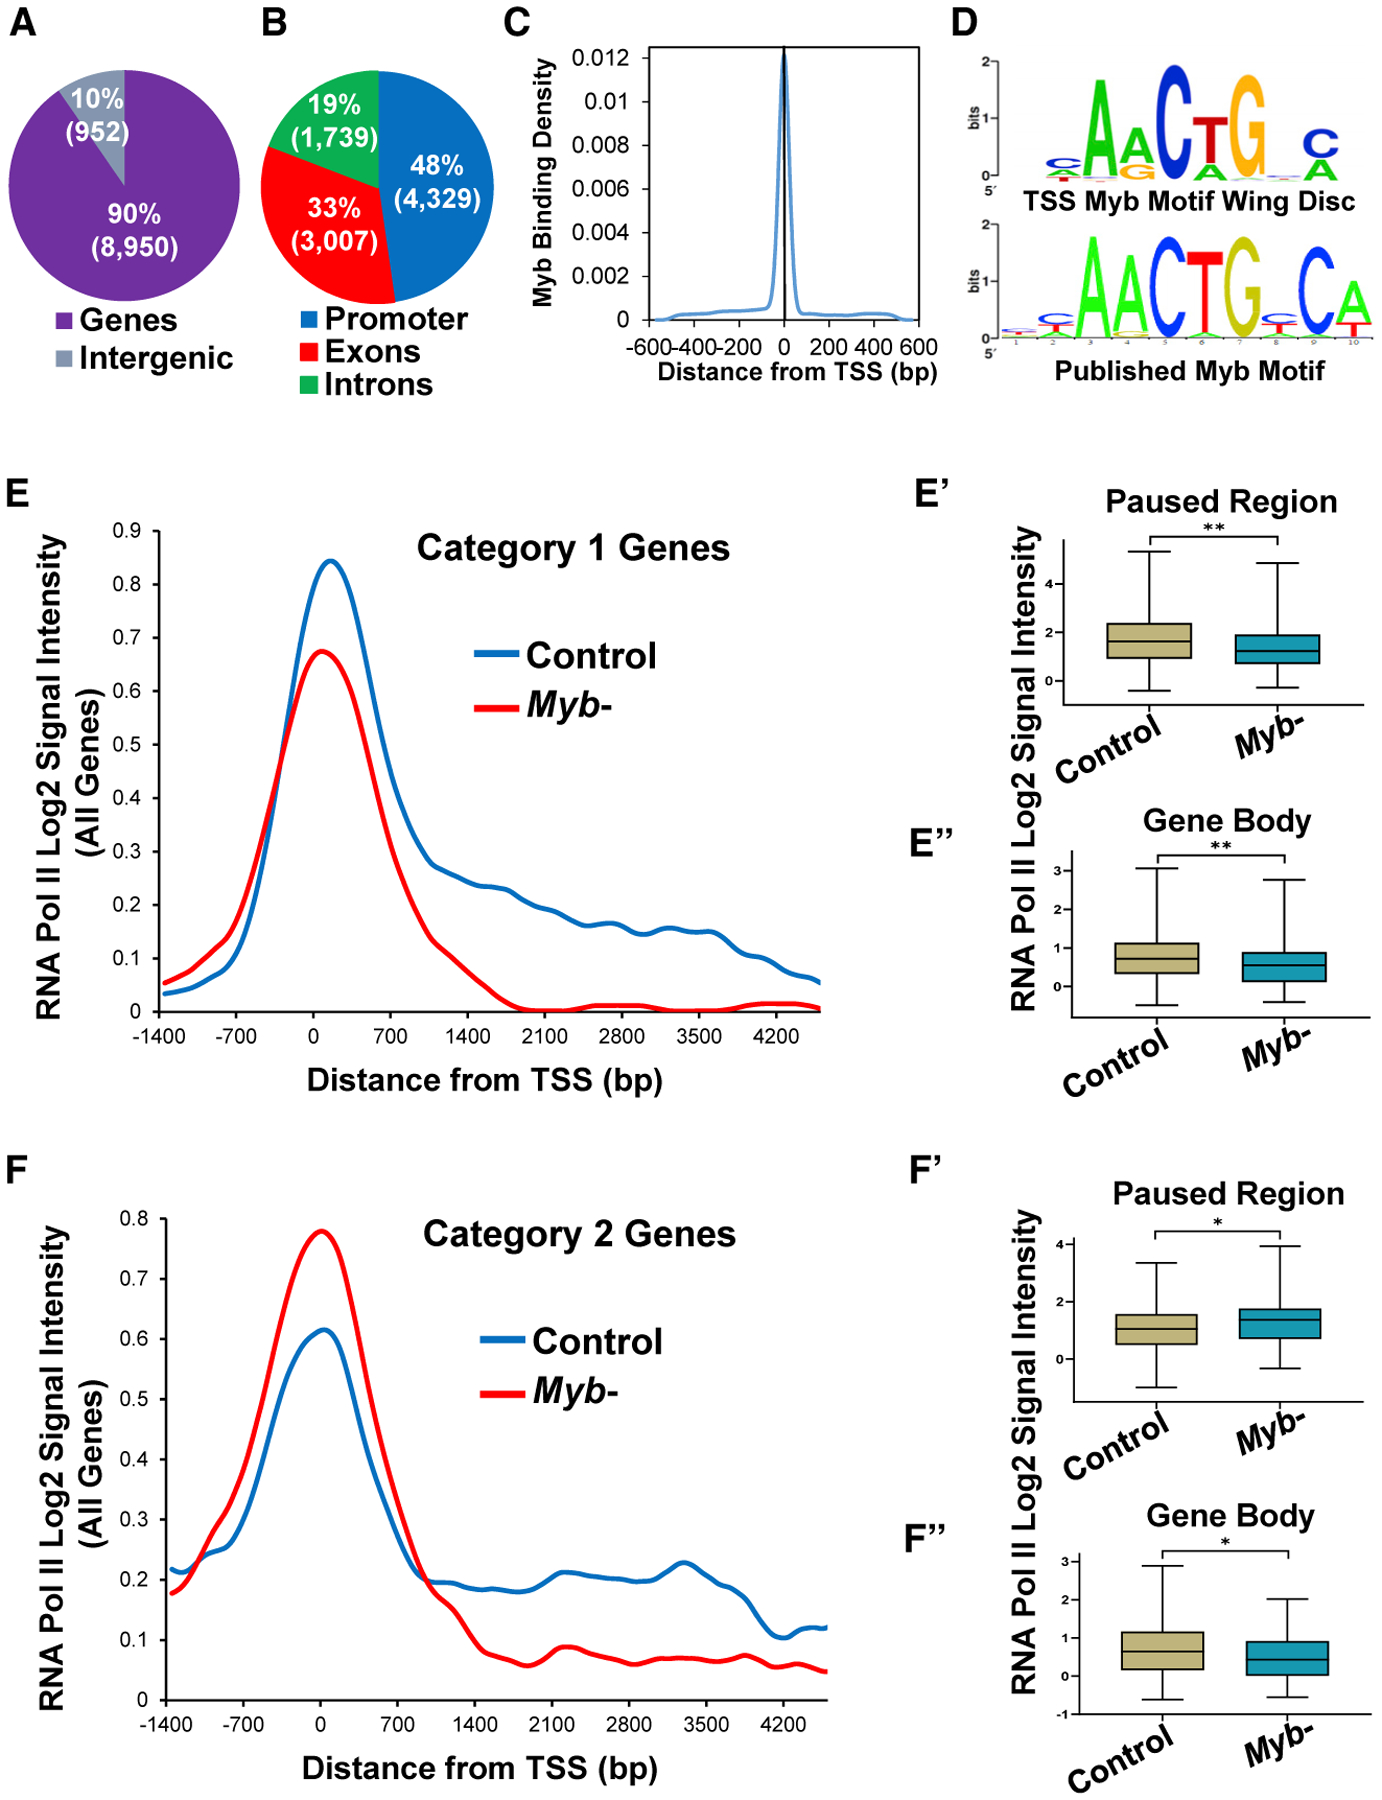
Figure 1. Myb Primarily Binds to TSS Regions to Promote Appropriate RNA Pol II Distribution at Target Genes.

(A) ChIP-chip analysis of Myb in wing imaginal discs reveals its preference for binding genic regions, with 90% of the Myb peaks within gene boundaries (p = 6.02 × 10⁻¹³ compared to shuffled control).
(B) Breakdown of Myb binding within genes shows enrichment for promoter (−200 bp to TSS; p = 5.79 × 10−156 compared to shuffled control).
(C) The frequency of Myb binding peaks is highest at TSSs (p = 1.75 × 10−171 compared to shuffled control).
(D) Enrichment of the Myb binding motif of peaks present at a TSS (p < 0.01).
(E–F′) Genes potentiated by Myb show two distinct RNA Pol II distribution profiles as determined by averaging the RNA Pol II signal for all genes per category. Category 1 genes (E, 159 total) show reductions in RNA Pol II levels in Myb mutants compared to control at both the Pol II paused region (p < 0.01; E′) as well as across the gene body (p < 0.01; E″), whereas category 2 genes (F, 122 total) show an increase in RNA Pol II levels at the Pol II paused region (p < 0.05; F′) in addition to a reduction in Pol II levels across the gene body (p < 0.05; F″) in Myb mutants compared to control. Boxes represent interquartile range (25th to 75th percentiles; brown boxes control, blue boxes Myb mutant); lines within boxes represent medians. *p < 0.05, **p < 0.01, Mann-Whitney test.
