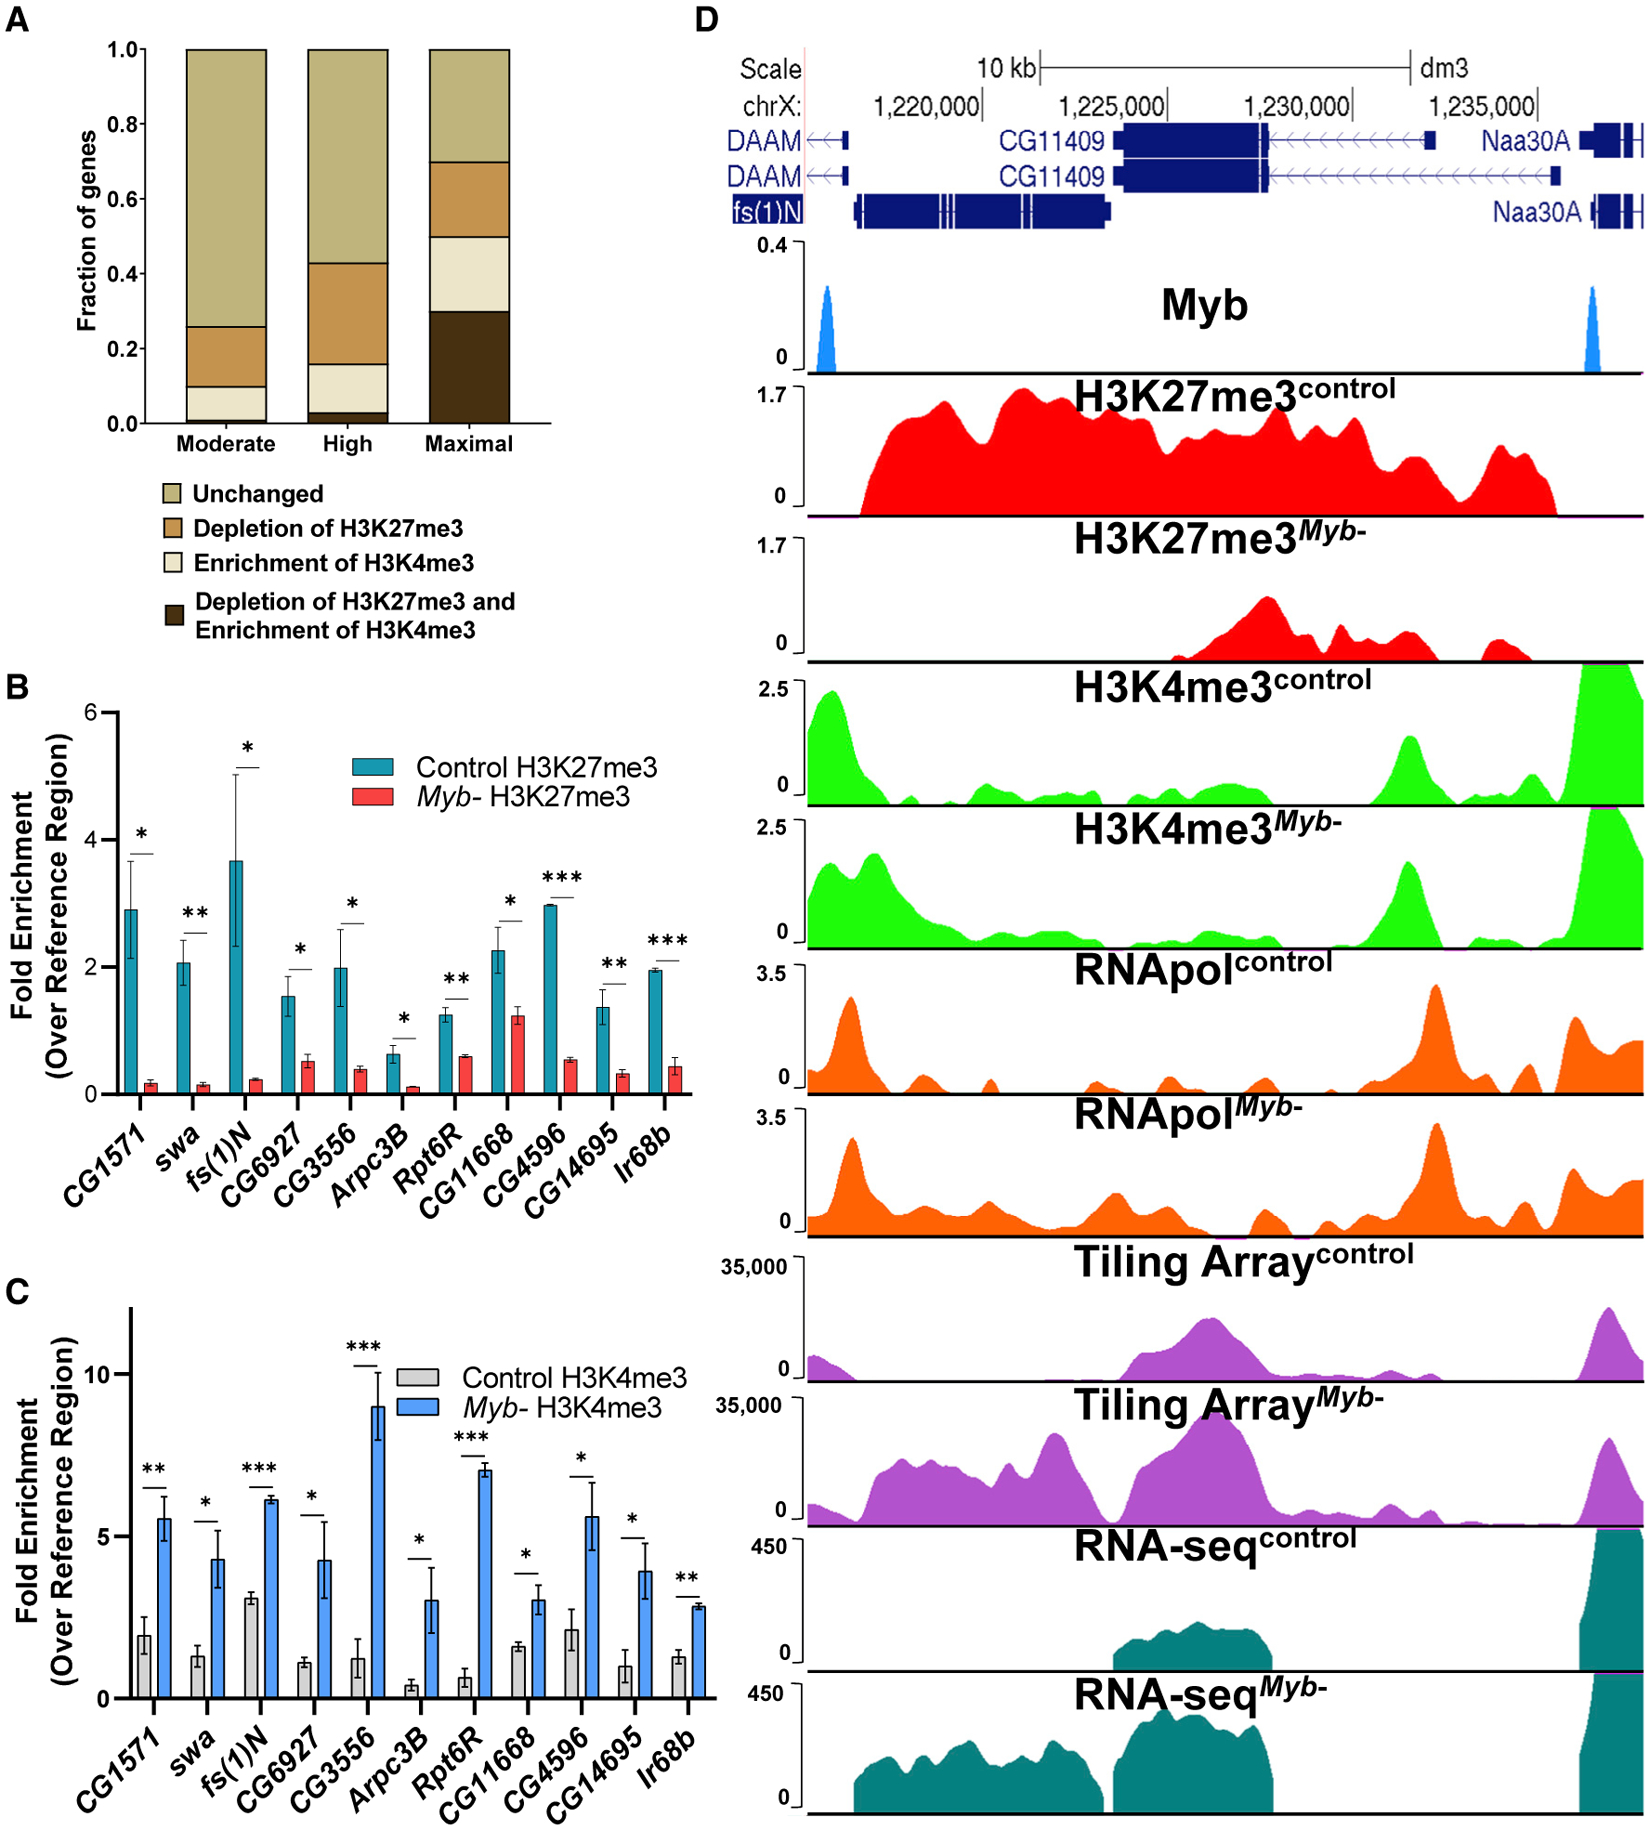
Figure 3. Loss of Myb Results in a Reduction of H3K27me3 along with Increased H3K4me3 and Upregulation of Genes within the Domain.

(A) Genes upregulated in Myb mutants (moderate, high, and maximal) were subdivided depending on whether they showed a depletion of H3K27me3 only, an enrichment of H3K4me3 only, or a depletion of H3K27me3 and enrichment of H3K4me3 (p < 0.05, Student’s t test). Genes not showing statistically significant changes were labeled as unchanged. Note that the most highly upregulated genes (maximal category) show the highest percentage of genes having both reduced H3K27me3 and increased H3K4me3 (30%) compared to the moderate or high categories (1% and 3%, respectively).
(B) ChIP-quantitative real-time PCR analysis of a selection of high to maximally upregulated genes reveals that H3K27me3 signal is reduced for all genes.
(C) ChIP-quantitative real-time PCR analysis of the same genes in (B) showing that H3K4me3 signal is increased for all genes.
(D) Representative example showing that loss of Myb leads to a reduction of H3K27me3 signal with H3K4me3 extension into fs(1)N, resulting in an increase of RNA Pol II occupancy and upregulation of transcription (array, ~22-fold upregulation, p = 2.44 × 10⁻²³; RNA-seq, ~188 fold upregulation, p < 0.0001). Extension of H3K4me3 does not extend into CG11409, but the reduction of H3K27me3 leads to its overall upregulation (array, ~1.7-fold upregulation, p = 1.01 × 10⁻⁸; RNA-seq, ~2.2-fold upregulation, p = 1 × 10⁻³²). For quantitative real-time PCR data, error bars represent mean ± SEM, *p < 0.05, **p < 0.01, two-tailed unpaired Student’s t test.
