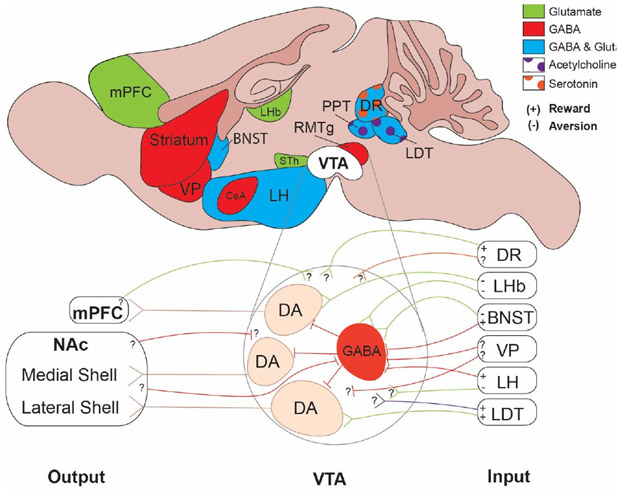
Figure 1. Input-Output relationships of dopamine neurons in the ventral tegmental area.
Top: Brain regions that send major inputs to the VTA are color coded according to the cellular identity of input neurons. Inset: detailed view of VTA functional connectivity based on recent studies that have combined synaptic electrophysiology and in vivo optogenetics. Note, that GABA neurons include those that are located in the VTA as well as RMTg. (+) and (−) indicate that optogenetic stimulation of a particular input induced reward (measured as place preference) or aversion (measured as place aversion). Question marks indicate that cell type- and/or projection-specific synaptic connectivity has not yet been established.

