
Fig. 1.
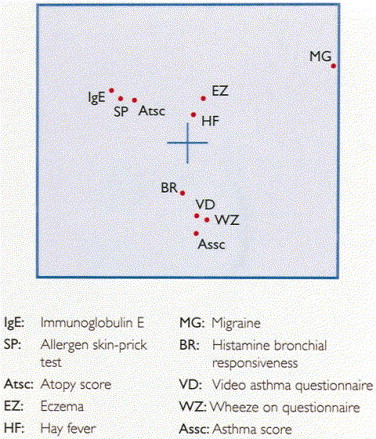
Eigenvector plot shows relationship between various clinical phenotypes and the summated scores for asthma and atopy derived by principal-component regression analysis.
Official websites use .gov
A
.gov website belongs to an official
government organization in the United States.
Secure .gov websites use HTTPS
A lock (
) or https:// means you've safely
connected to the .gov website. Share sensitive
information only on official, secure websites.
Eigenvector plot shows relationship between various clinical phenotypes and the summated scores for asthma and atopy derived by principal-component regression analysis.