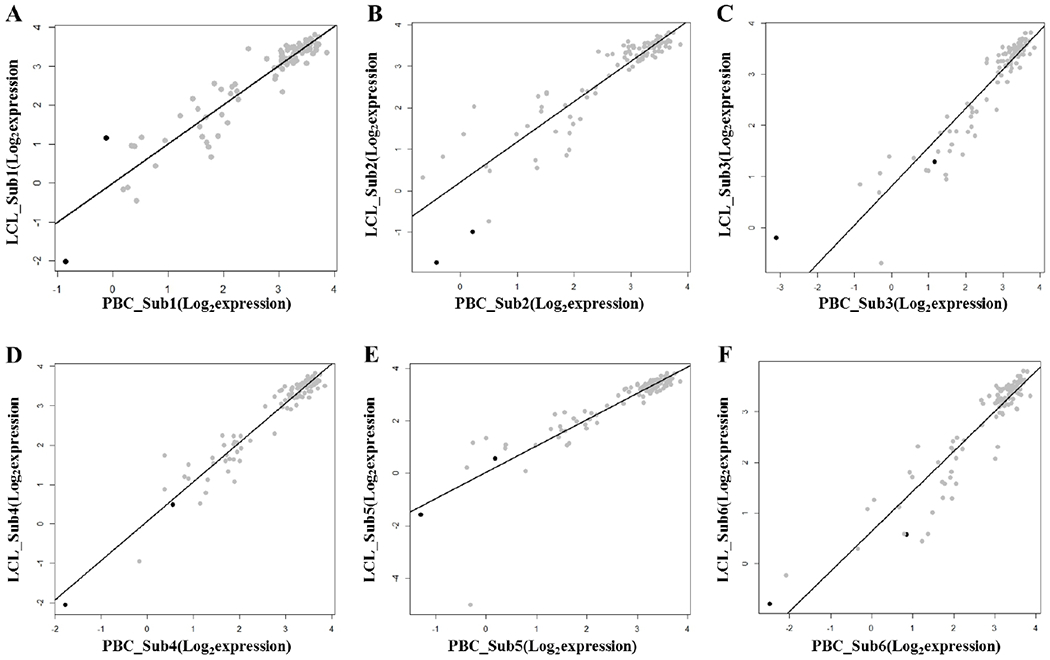
Figure 4.

Correlation of the dexamethasone-regulated gene expressions between primary B cells and lymphoblastoid cell lines in the GSE30916 dataset
A. Subject 1
B. Subject 2
C. Subject 3
D. Subject 4
E. Subject 5
F. Subject 6
Black dots represent two genes showing significantly differential expressions between PBCs and LCLs in GSE30916 (FDR q < 0,05).
