
Fig. 1.
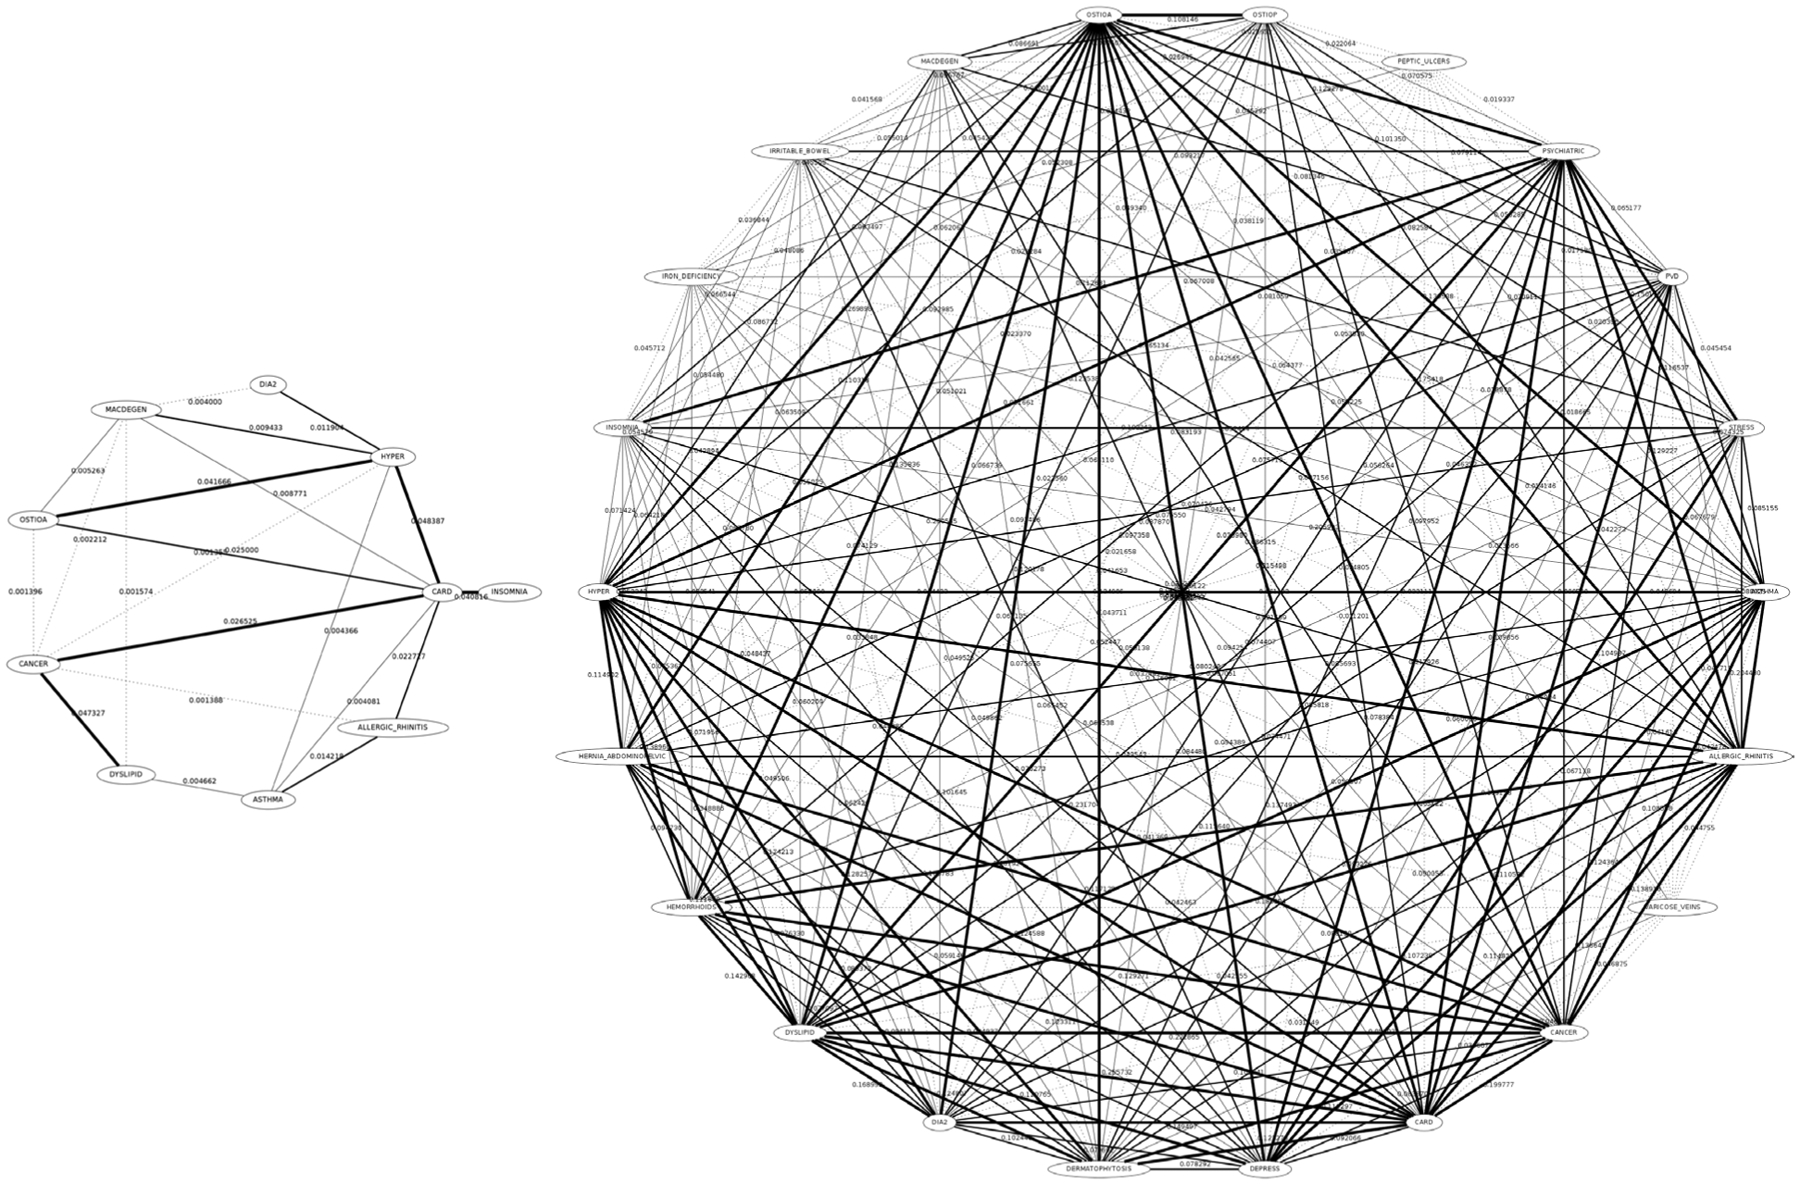
Genotypic (left) and Phenotypic (right) networks for the EUR ethnic group. Nodes are GERA dbGap disease categories (for the genotypic network) having at least one significant SNP marked by the GWAS experiment or patients (for the phenotypic network). Arcs weights are the Jaccard Index between two nodes (number of SNPs in common over the total SNPs for the genotypic or number of patients in common for the phenotypic network). Arcs line styles have been depicted according to the percentiles of the weights (dotted for the 0 – 25th percentile, thickest for the 75 – 100th percentile).