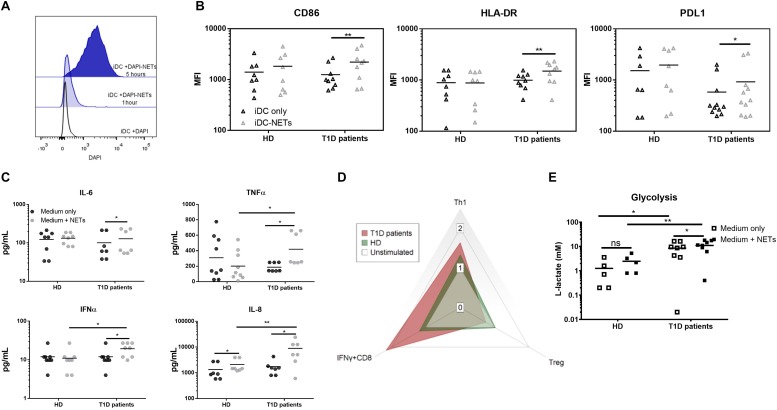
FIGURE 2.
Monocyte-derived dendritic cell functional analysis. (A) Representative histogram of the interaction between moDCs and autologous NETs dyed with DAPI. (B) CD86, HLA-DR and PDL1 expression in the moDC co-cultured with or without autologous NET from 9 T1D patients (67% female) and 8 healthy donors (62% female) detected by flow cytometry. (C) Cytokine production by moDCs from 7 T1D (57% female) and 8 healthy (62% female) donors co-cultured with or without autologous NET analyzed by Luminex. (D) Radar graph displaying a shift between T cell populations induced by moDCs co-cultured with or without autologous NET. Data are expressed as the median of the response index (% of cells cultured with NETs/% of cells cultured without NETs). T cell populations analyzed by flow cytometry are defined as Th1 (IFNγ+CD4), Treg (FoxP3+CD25hiCD127-CD4) and IFNγ-producing CD8+ lymphocytes. (E) moDCs of 8 T1D (62% female) and 5 healthy (60% female) donors were incubated with or without autologous NETs for 24 h, and then the L-lactate concentration in the culture supernatant was measured as an indicator of glycolytic activity by ELISA. Statistical analysis was performed using a two-tailed Wilcoxon paired t-test and an unpaired t-test. Values of p < 0.05 (*), p < 0.01 (**) and p < 0.001 (***) were considered statistically significant.

