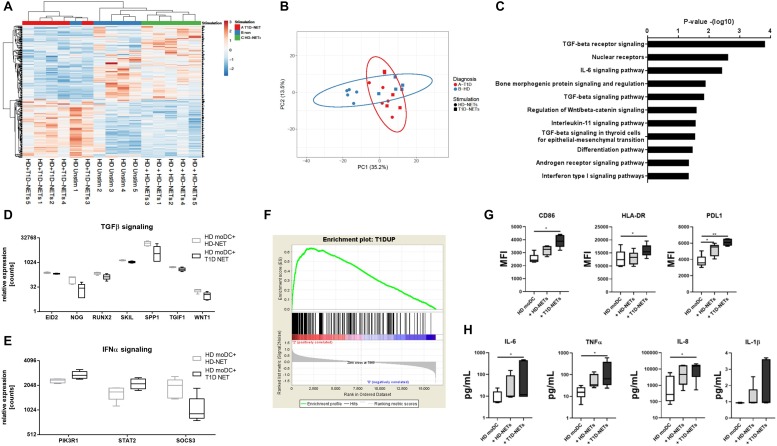
FIGURE 4.
Analysis of RNA-Seq data from HD moDCs stimulated with autologous NETs versus HD moDCs stimulated with heterologous T1D NETs. (A) Cluster analysis of HD unstimulated moDCs, stimulated with autologous NETs and heterologous NETs. (B) principal component analysis (PCA) of HD and T1D moDCs stimulated with autologous NETs or heterologous T1D NETs (C). WikiPathways analysis of enriched pathways involved in moDC after NET stimulation (D) and (E) relative expression of enriched genes involved in TGFβ and IFNα signaling (F) GSEA (gene set enrichment analysis) of created a T1D signature gene set containing 1568 DEGs that were differentially expressed between unstimulated healthy moDCs and unstimulated T1D moDCs, divided into those that were upregulated and downregulated in T1D compared to HD. moDC from healthy donor (n = 5) (40% female) were cultivated with autologous healthy NETs (HD-NETs), heterologous T1D-NETs or left untreated for 24 h and their (G) phenotype determined by flow cytometry and (H) cytokine production analyzed by Luminex were evaluated. Statistical analysis was performed using unpaired t-tests. Values of p < 0.05 (*) and p < 0.01 (**) were considered statistically significant.

