. 2020 Apr 8;142(7):071011. doi: 10.1115/1.4046201

Fig. 9.

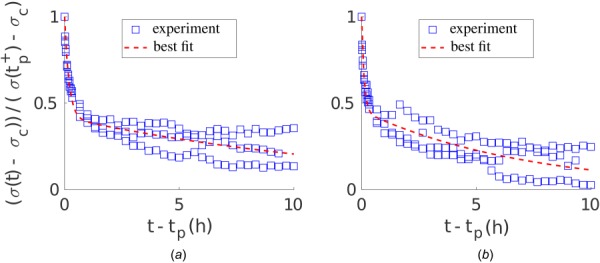
Best fit of Eq. (1) with n = 2 exponentials to stress recovery data (hours 27–37) of uniaxial experiments shown in Figs. 8(a) and 8(d). (a) Decreased load perturbation from the homeostatic state according to Fig. 8(a); (b) increased load perturbation from homeostatic state according to Fig. 8(d).

Best fit of Eq. (1) with n = 2 exponentials to stress recovery data (hours 27–37) of uniaxial experiments shown in Figs. 8(a) and 8(d). (a) Decreased load perturbation from the homeostatic state according to Fig. 8(a); (b) increased load perturbation from homeostatic state according to Fig. 8(d).