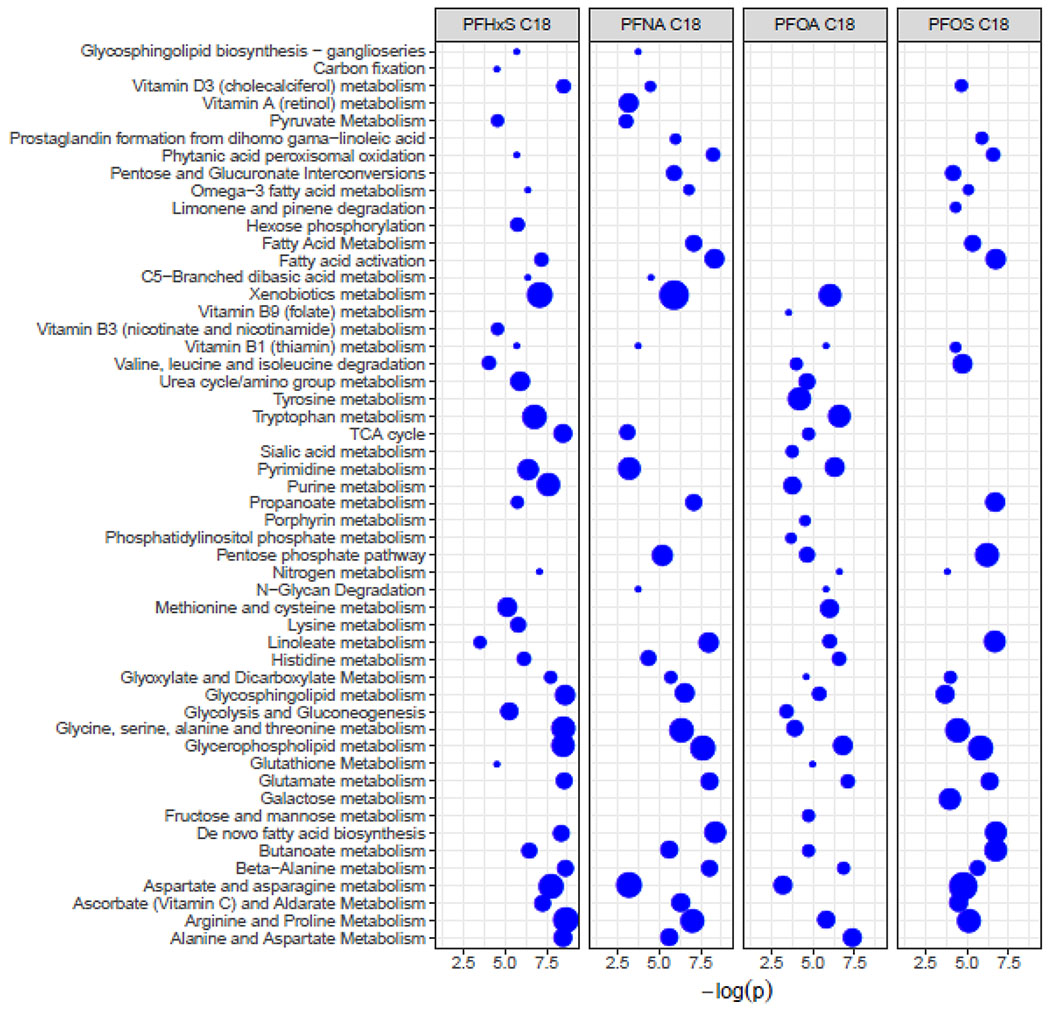
Figure 5:
Enriched pathways associated with serum PFOA, PFOS, PFHxS, or PFNA concentrations in C18-negative mode among HOME Study children, Cincinnati, OH
Note: The size of the dot represents the number of overlapping metabolites in the pathway. The position of the dot is determined by the −log p-value obtained from 10,000 permutations.

