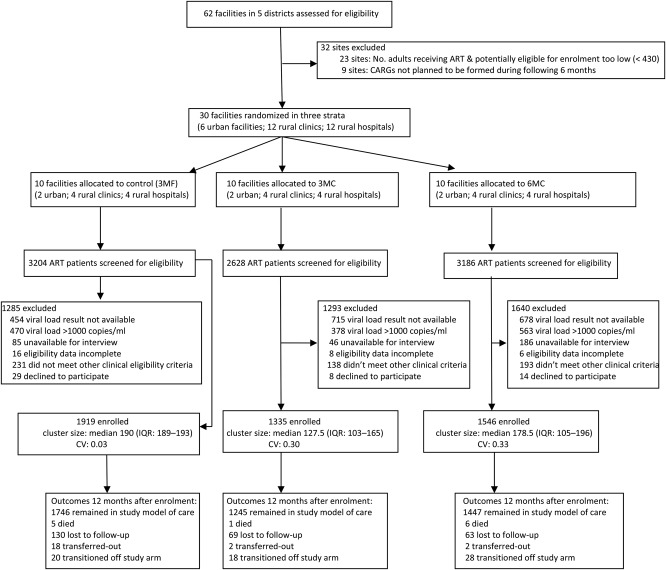
Figure 1.
Trial flow diagram. CV, coefficient of variation of cluster size; IQR, interquartile range; CARGs, community ART refill groups; 3MF, participants received three-monthly dispensing of ART at the facility; 3MC, participants received three months’ supply of ART in CARGs; 6MC, participants received 6 months’ supply of ART in CARGs.

