
Fig 2.
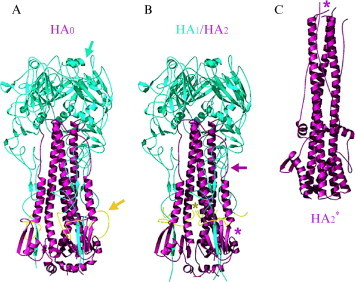
The influenza virus hemagglutinin. (A) HA0, before cleavage between HA1 and HA2. The HA1 part of the protein is blue; the HA2 part, is purple. The fusion peptide, looped out before cleavage, is yellow. The sialic acid‐binding site and the cleavage point are shown by blue and yellow arrows, respectively. (B) The mature HA after cleavage but before low‐pH triggering. The only change from the structure in (A) is insertion of the fusion peptide (the N terminus of HA2, in yellow) into a crevice along the three‐fold axis (dark yellow asterisk). A purple arrow points to the loop between the shorter, N‐proximal helix and the longer, central helix. A purple asterisk indicates the position of residues that will move to the top of the molecule during the low pH‐induced transition. (C) HA2 after exposure to low pH. The same structure can be obtained by refolding HA2 expressed in E. coli. It is the minimal free‐energy state of HA2 unconstrained by covalent association with HA1. The long loop in the prefusion structure (purple arrow in [B]) has now become helical, elevating the N terminus of the protein (the fusion peptide itself is not included in this structure) to the top of the molecule (purple asterisk). A break and reversal of direction in the central α‐helix of the prefusion trimer likewise projects the C terminus of the protein to the top. The figure is aligned with respect to (B) so this break is roughly at the same height in both panels. In the actual transition, the chain reversal is likely to occur by melting and rezipping of the C‐terminal helical segment, as shown in Fig. 3C. For detailed references, see Skehel and Wiley (2000).