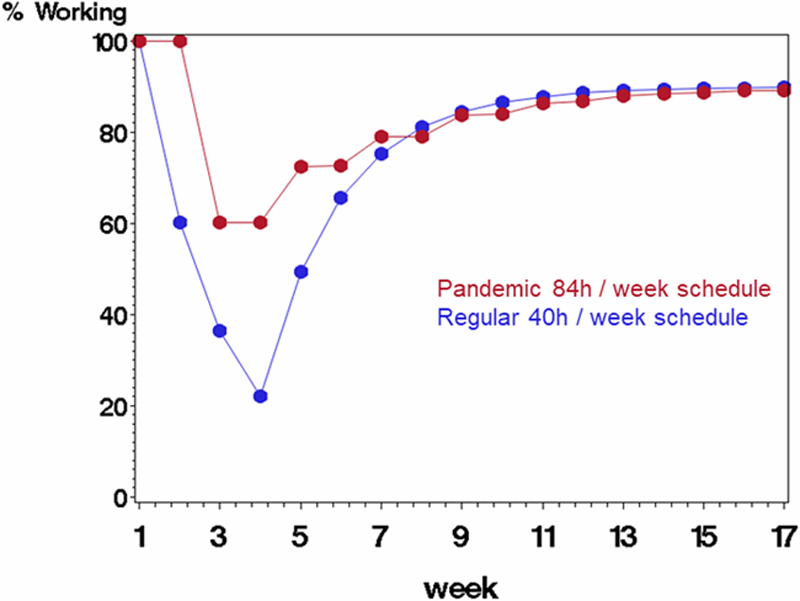
Figure 3.

Comparing scenario B (rotating staff each week in a pandemic schedule with 84 h/wk followed by 1 wk off, displayed in red) with scenario A (regular schedule with 40 h/wk, displayed in blue) on percentage of starting work force available to work each week. The average probability of being infected at work was 0.40 (each staff member’s probability was a random draw from the underlying probability), and probability of mortality if infected was 10%. Infected staff were quarantined for 3 wk before returning to work.
