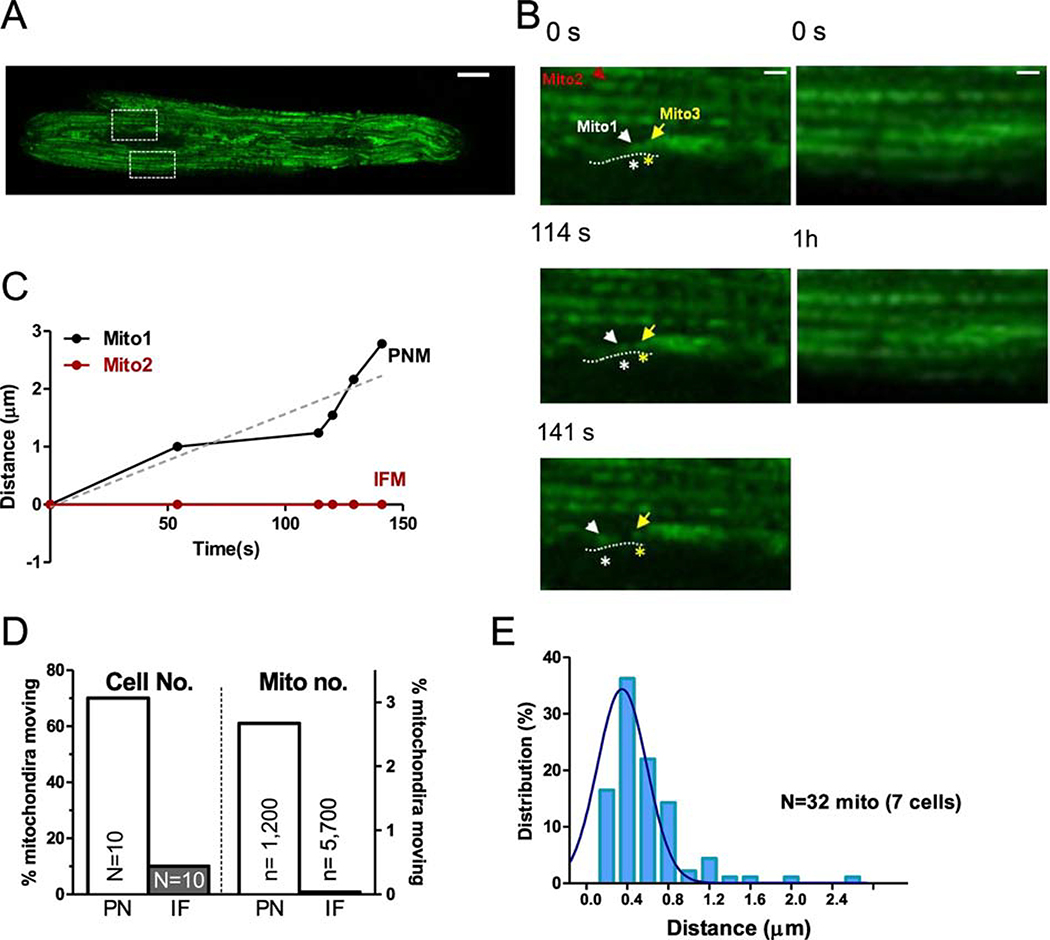
Figure 2. Motility of individual mitochondrion in adult cardiac myocytes.
(A) Right: expression of mitochondrial indicator Ad-mtGFP in adult cardiac myocytes (scale bar: 10 μm), (B) Enlarged images from the indicated myocytes regions in A (IF: lower ROI and PN: upper ROI) at different time points (scale bar: 4 μm). (C) Distance moved by individual mitochondria indicated in B (IFM: mito2 and PNM: mito1) Mito1 (labeled with white *) moved along the nuclear edge indicated by dash lines and away from the neighbor mitochondrion Mito3 labeled with yellow *. (D) Percent of cells (N, left)) and mitochondria (n, right) exhibiting movement and (E) distribution of distances moved by individual mitochondrion moved in PNM and IFM (n= 7 cells).

