
Figure 1.
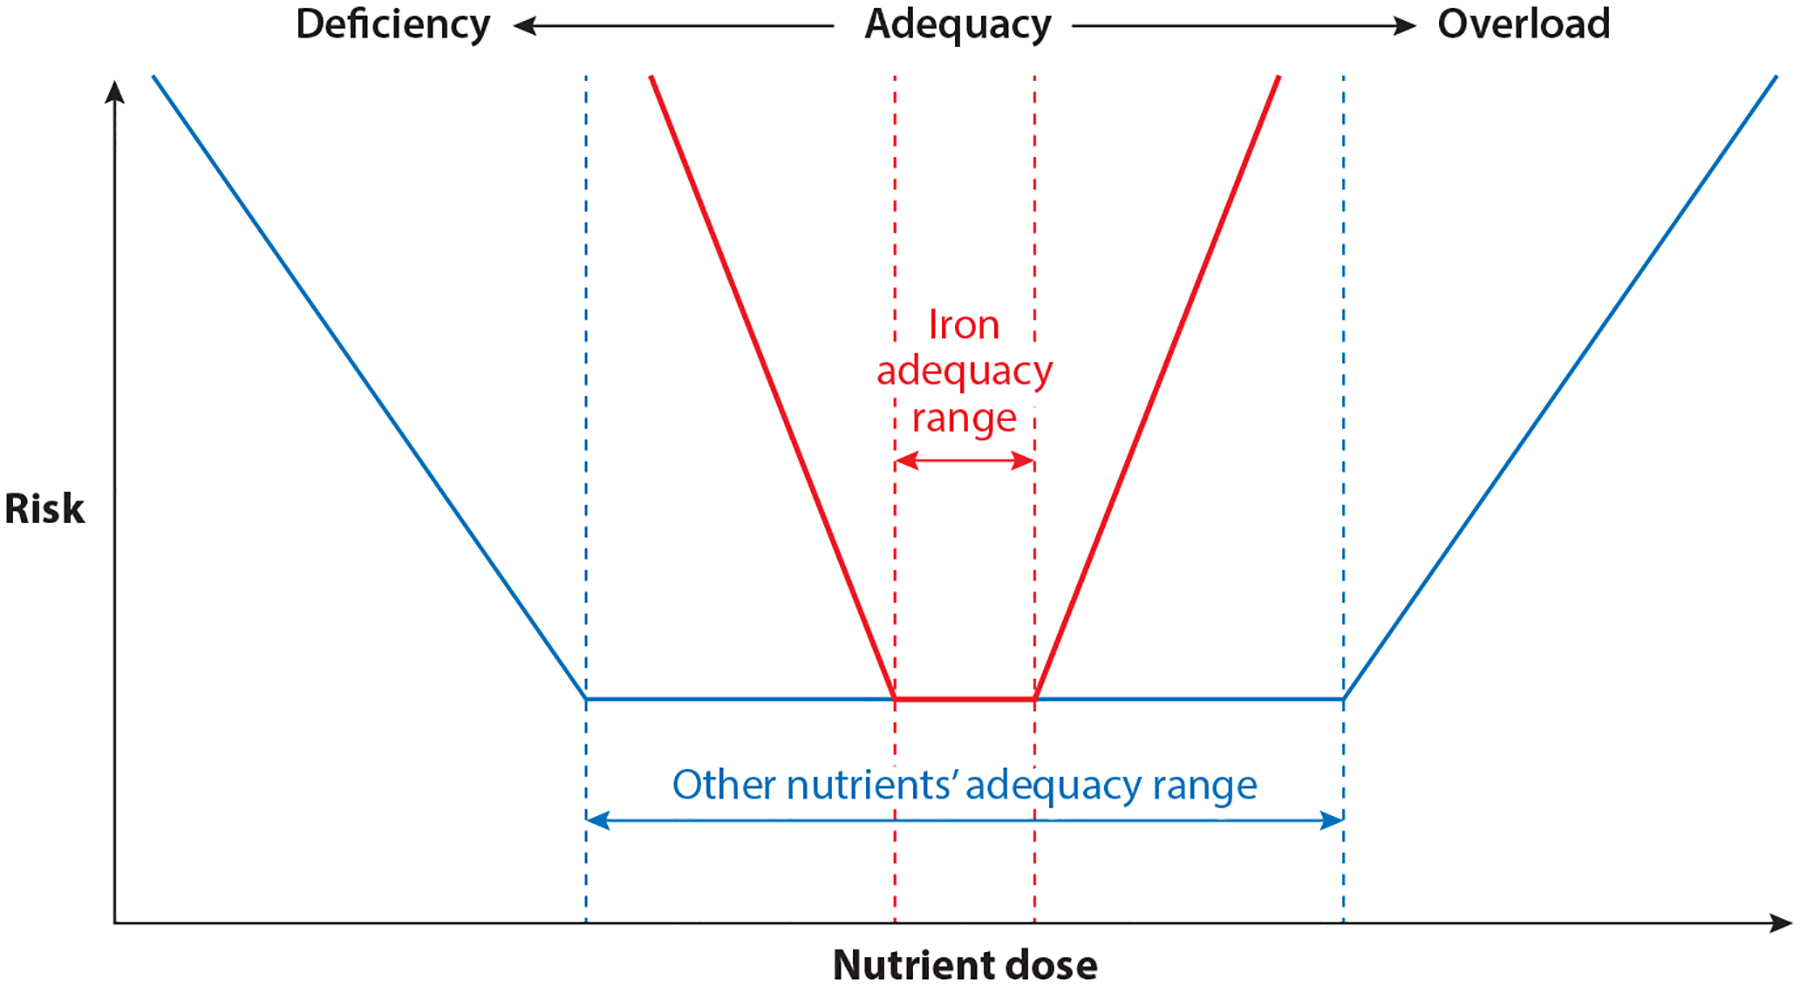
The U-shaped risk curve exhibited by most nutrients. Iron has a narrower adequacy range (red dashed lines), and risks from deficiency or overload states are greater compared with those from most other nutrients.
Official websites use .gov
A
.gov website belongs to an official
government organization in the United States.
Secure .gov websites use HTTPS
A lock (
) or https:// means you've safely
connected to the .gov website. Share sensitive
information only on official, secure websites.
The U-shaped risk curve exhibited by most nutrients. Iron has a narrower adequacy range (red dashed lines), and risks from deficiency or overload states are greater compared with those from most other nutrients.