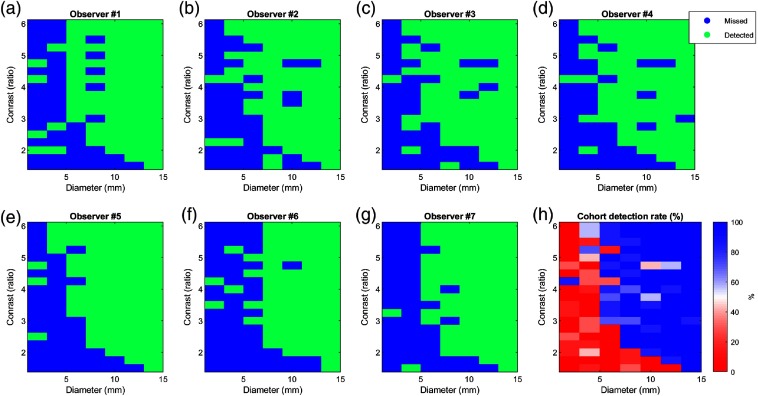
Fig. 9.
(a)–(g) Matrices of correct lesion detection (accurate localization) for each of the observers as a function of lesion diameter (millimeter) and background-to-lesion ratio. Green and blue indicate detected and missed lesions, respectively. (h) Percentage accurate detection rate chart for the entire cohort.

