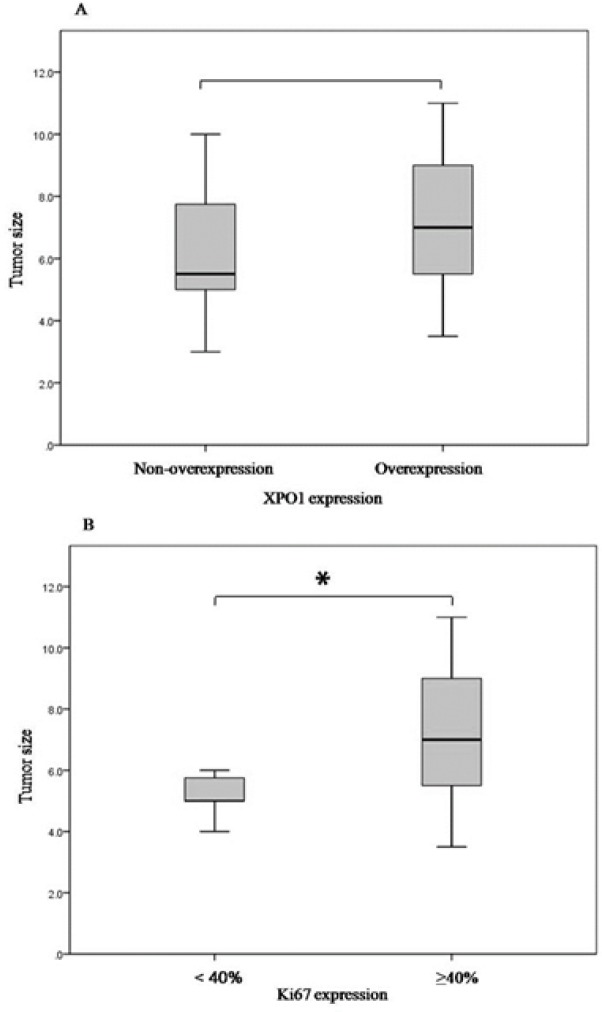
Figure 3.
Correlation between the XPO1 overexpression and Ki67 with tumor size. Mann-Whitney test demonstrate that the tumors with larger size exhibit significant high Ki67 expression (A) (P=0.012) and to some extent the XPO1 overexpression (B) (P=0.168). * represents the significant statistical differences between groups at P<0.05

